Hi everyone,
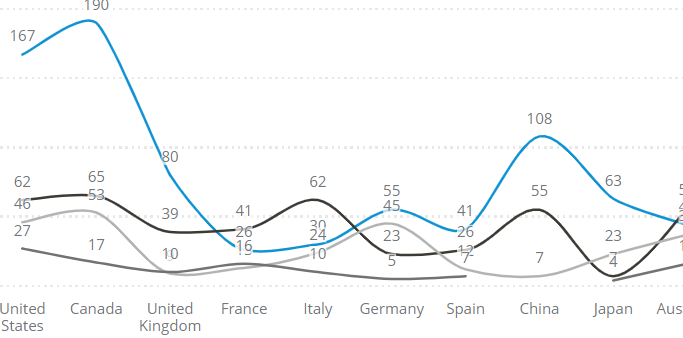
As you can see in the below image, dark grey line breaks in Spain and continued in Japan. Even though there is no data in China, I need it to display as 0. Is it possible?

Hi everyone,
As you can see in the below image, dark grey line breaks in Spain and continued in Japan. Even though there is no data in China, I need it to display as 0. Is it possible?

Hi
Also, you can even move China at the very end so that you do not get a line break in between.
Hi
Hi
Lower limit of vertical range is set as 0.
Hi
Also, you can even move China at the very end so that you do not get a line break in between.
Count!
I need to display the country only in that order
Hi
I don’t know if i am seeing it right but there are 4 lines and the counts (7) above china is for light grey colored line.
its just that because of light grey line 0 is not visible.
Please correct me if i am wrong 
Hi
I don’t know if i am seeing it right but there are 4 lines and the counts (7) above china is for light grey colored line.
its just that because of light grey line 0 is not visible.
Please correct me if i am wrong 
thats right. But I need that line to be continued and it should display zero for china.
Hi
I don’t know if i am seeing it right but there are 4 lines and the counts (7) above china is for light grey colored line.
its just that because of light grey line 0 is not visible.
Please correct me if i am wrong 
thats right. But I need that line to be continued and it should display zero for china.
Instead of changing the order of country. Maybe you can changing the position of the lines
.

If you want to show how those line compete with each other from West-to-East. You can still show the propotion by clicking normalize-chart in the style tab.
If you wanna Count, I can’t think of a way to show this as 0 for you. I have the same problem when it comes to count.
Hello
If you want to show how those line compete with each other from West-to-East. You can still show the propotion by clicking normalize-chart in the style tab.
If you wanna Count, I can’t think of a way to show this as 0 for you. I have the same problem when it comes to count.
Hello, thank you so much for reaching out. As an XM Community Admin, I am an expert in all things community; unfortunately, I am not a product expert. For more information about the role of an Admin, check out this post!
However, I do believe that the break in the line is expected functionality due to the lack of data for that specific field.
I’d suggest reaching out to our Support team, to verify that this is in fact expected functionality and ask to see if there are any alternative solutions.
I’d also recommend posting or searching for this idea on Evolve. 😁 If you’re not sure how to post your idea, check out our Create an Idea post.
And yes, you’re right. If it COUNT and didn’t find anything, it should return “0” instead of “null”, this thing need to be fixed in the next update. Thank you for introducing Evolve to me.
Enter your E-mail address. We'll send you an e-mail with instructions to reset your password.