Comparisons in dashboard widget | XM Community
Skip to main content
Solved

Comparisons in dashboard widget


Hello community 
could you please help me with this:


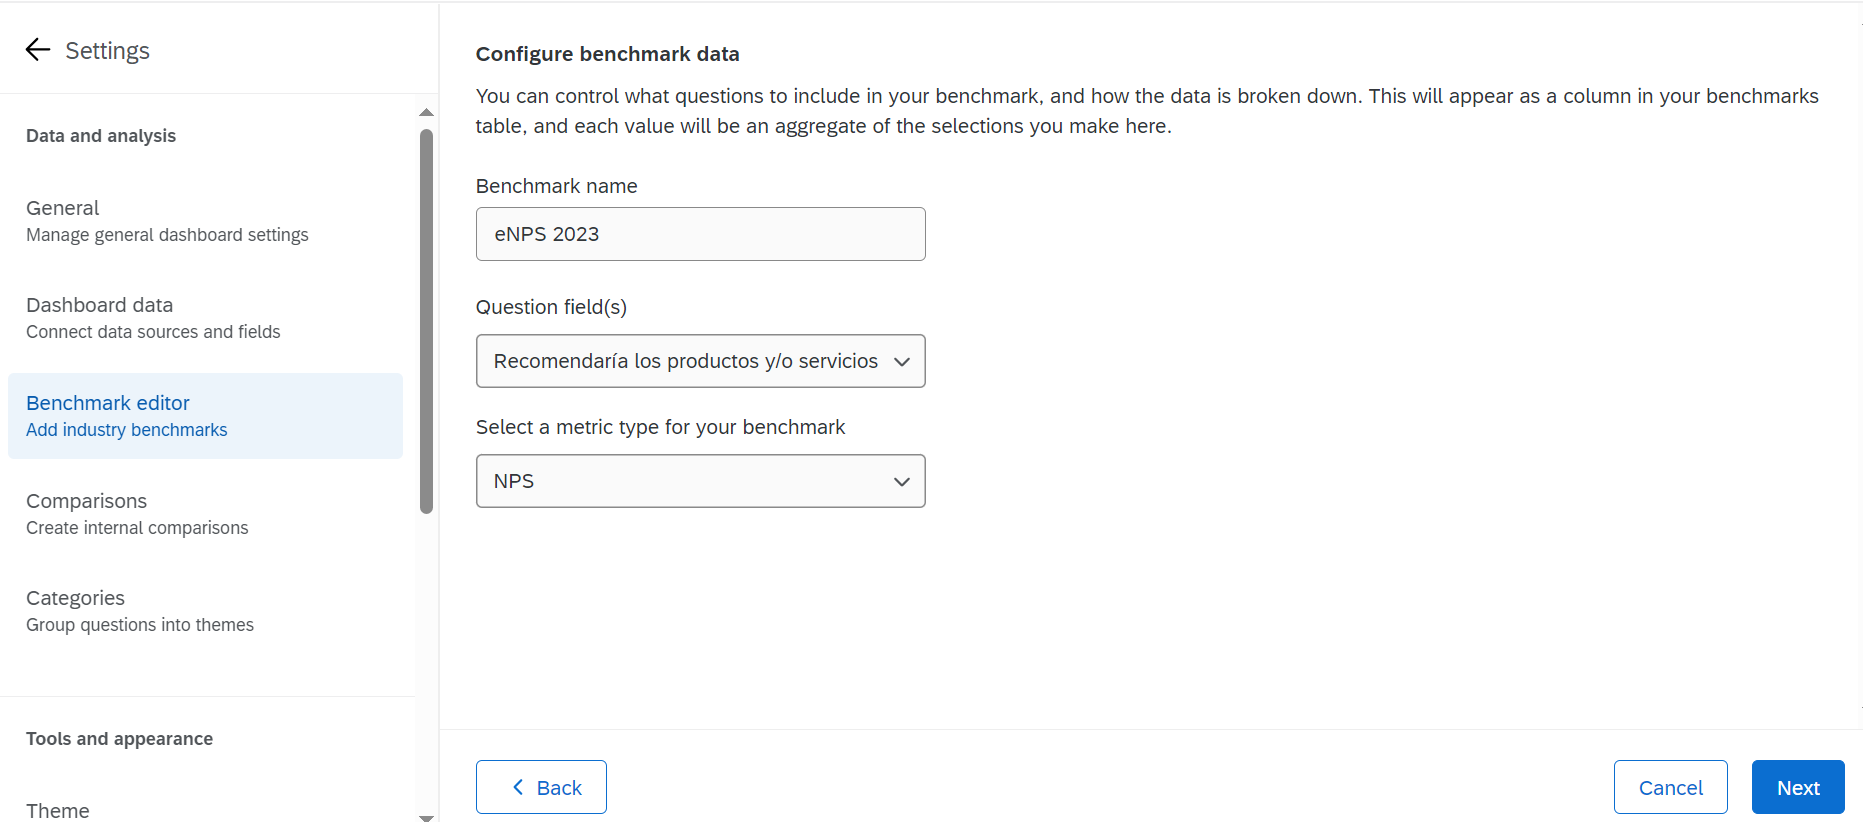
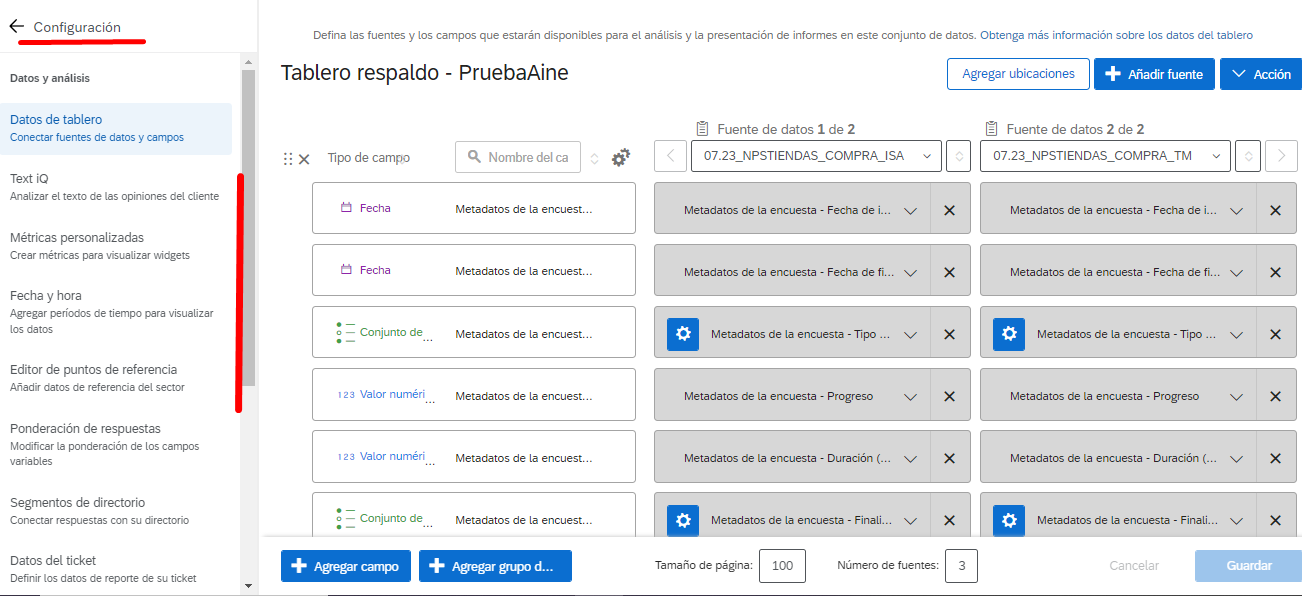
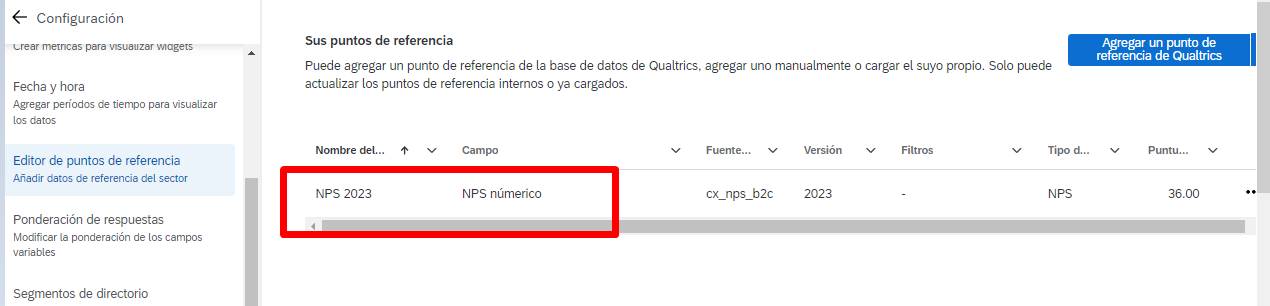
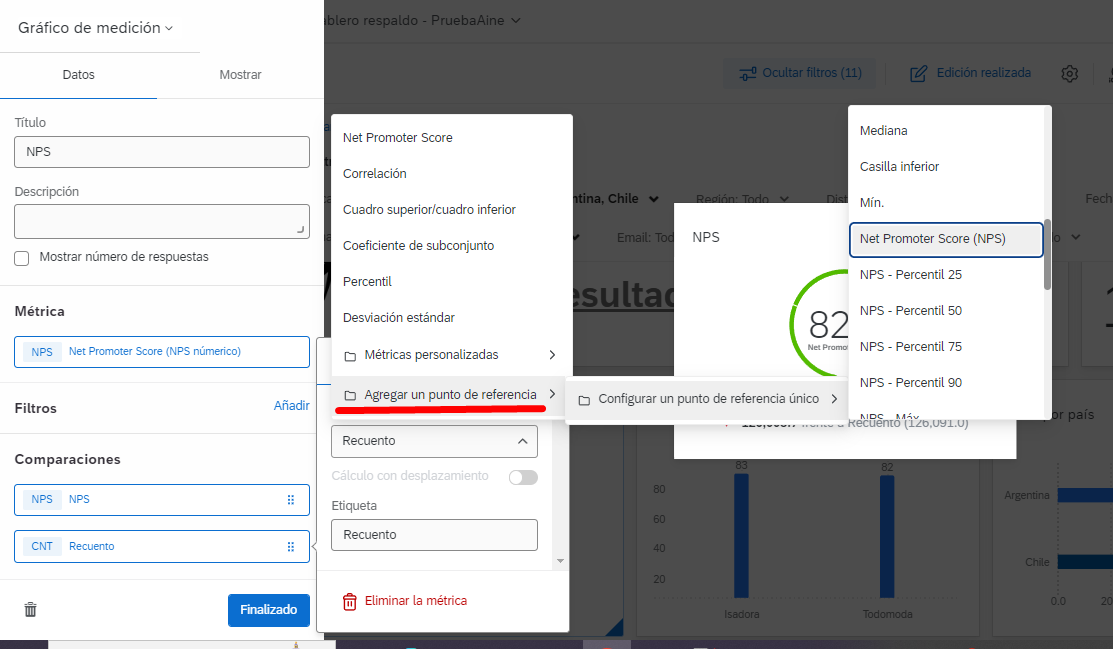
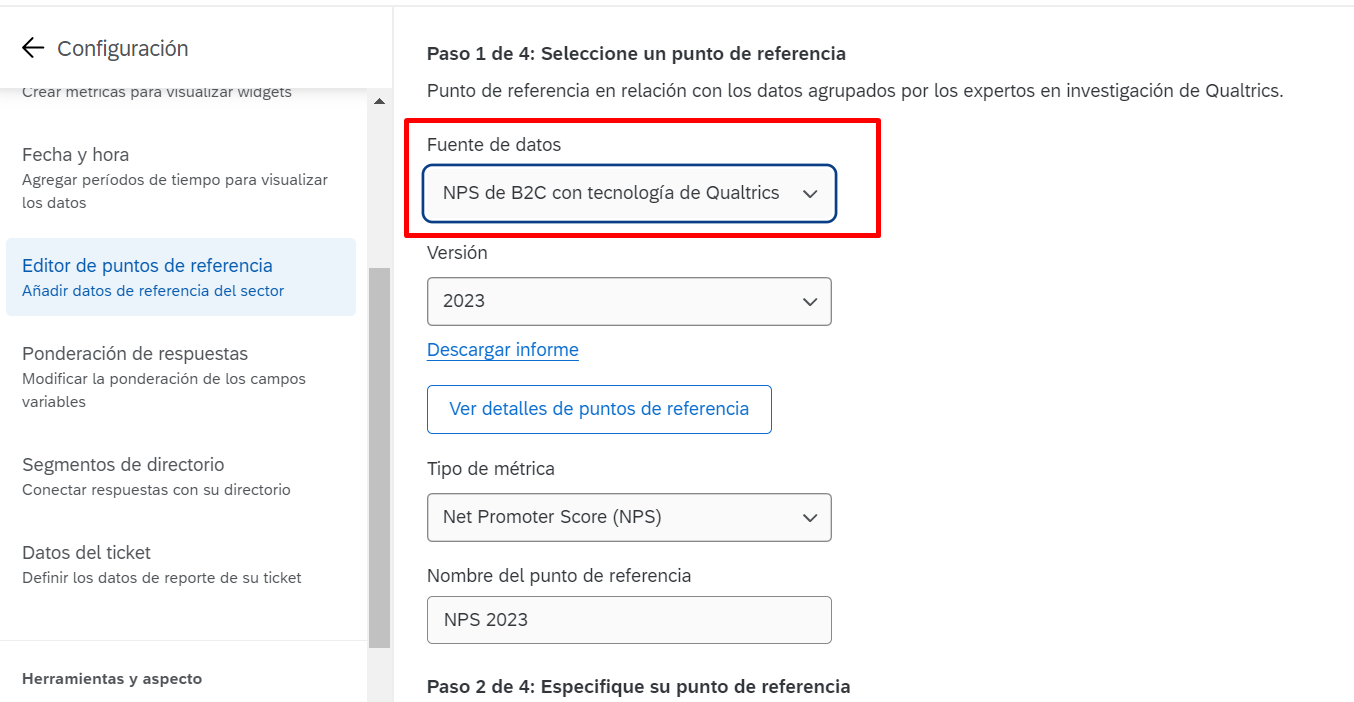
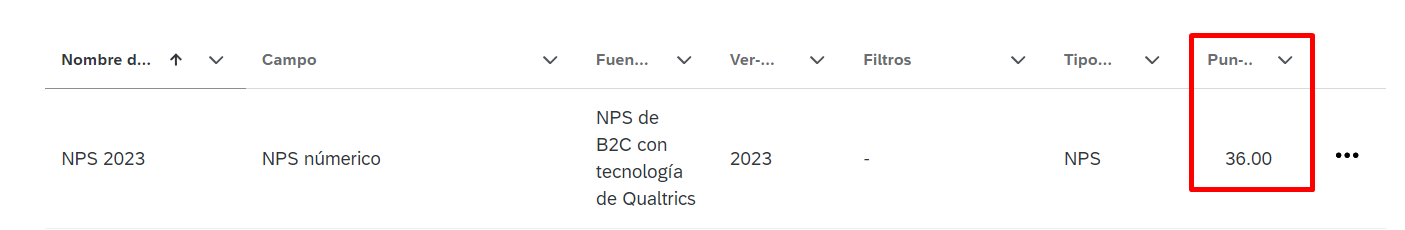
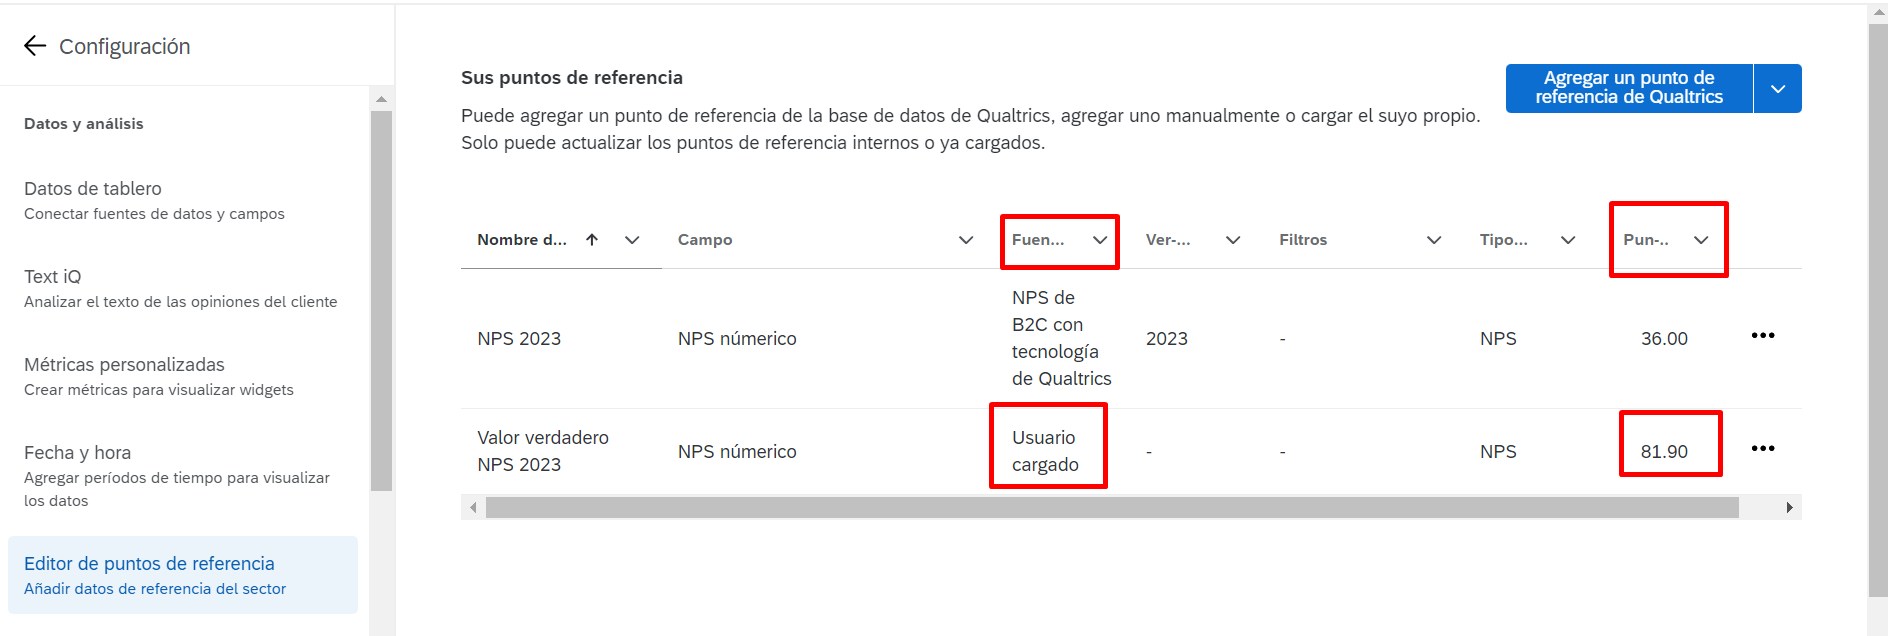
When I try to add a filter it tells me that I need to set a unique benchmark to apply a filter. Where do I configure the latter or how can I do what I need to do?

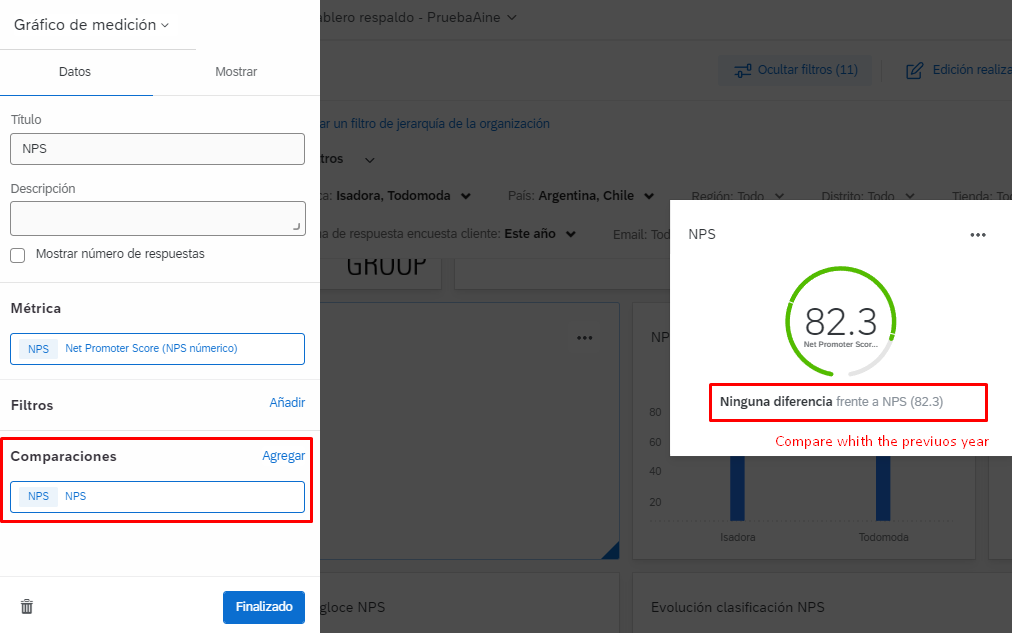
I need in this widget to compare the NPS with the previous year's NPS 


Thanks

10 replies

Userlevel 3
Badge +14

Hi, I hope you're doing well.

To configure it the benchmark, follow these steps:

  1. Go to Dashboard Settings.
  2. Select Benchmark Editor.
  3. Add a benchmark manually.
  4. Assign a name to the benchmark.
  5. Select the relevant question and the metric type "NPS."
  6. On the next screen, manually enter the benchmark score.


Once you have added the benchmark, it will be available to use in the comparison of your gauge chart widget.


I hope this helps.

Userlevel 1
Badge +2

Hi @YenMejia_Voce 

thank you for helping me ...


as I show you in this print, I don't have that functionality, is there another way to make the comparison?


thanks again

Badge +9

Hi @Aine ,


Aine’s screenshot


I think the “Editor de puntos de referencia” in your screenshot is the “Benchmark editor” that YenMejia_Voce mentioned.

Userlevel 1
Badge +2

Hi @YenMejia_Voce 

thank you very much, as you can see I was able to create the benchmark....

Now I ask you how do I add it to the widget comparison, because when I add a comparison I can't find the newly created benchmark?
I attach an image

Can you help me with this?


Userlevel 1
Badge +2

Hi @YenMejia_Voce 

I already have the reference point, I had forgotten to update....

Thank you very much

Userlevel 1
Badge +2

Hi @YenMejia_Voce 

I ask you when I created the benchmark, I realized that the data source is on a set of data from other companies, is that correct?
I mean, what I need is the global NPS of last year (2023) but from our company.


I am telling you this because the score it gives me is not the correct one....

Thanks for your help

Userlevel 3
Badge +14

Hello Aine. Maybe try to create another benchmark but this time, “Add benchmark manually”, because in the capture you share it shows “Data Source” → NPS de B2C, it should appears “User uploaded”.

Userlevel 1
Badge +2

Hello @YenMejia_Voce 

Ahh yes yes I tried creating a reference point, but I understand that this reference point creates a fixed value, which is the one I write .... as if it were a target to be met

Something that I did use and it helped me is the Historical Comparisons in the metrics, this took the NPS of the previous years. 


Userlevel 3
Badge +14

Aine, that's right. This type of chart is commonly used to show an exact value of an indicator. However, for comparisons, it only accepts benchmarks or reference points. Therefore, if we want to compare ourselves against a historical indicator, we must manually add it as a benchmark, just as you mentioned. In that last case, it is static, so we assign it an exact value, for example, the exact NPS obtained in the previous year.

I hope this is helpful for you.

Userlevel 1
Badge +2

Yen ahh thank you very much!
Excellent your explanation and clarification

Leave a Reply