
Hi, I built a visualization about "Top 5 countries with positive and negative change in road traffic death (rate per 100,000) between 2000 & 2019 based on data from WHO.
I created this visualization in short time and without any programming skill using Tool.
My question is there a way to create advance visualizations like this?
Thanks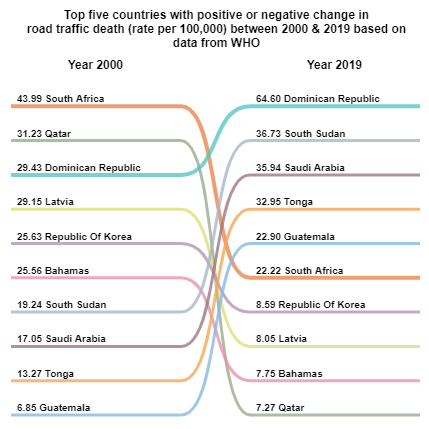
Best answer by AdamK12
View original
