Hi all,
I am attempting to find a way to not have to manually enter new responses each month. Briefly, each month I send the same survey to the same person and they enter status updates on a recommendation. The table in 6.4.3.1 is an example of the cumulative table with all recommendations thus far.
Is there a way to pull the responses from 6.4.3.2 to update the table in 6.4.3.1? I was thinking with embedded data but not sure if this is the correct route? Also open to any other suggestions because this might not be the best way to go about this! 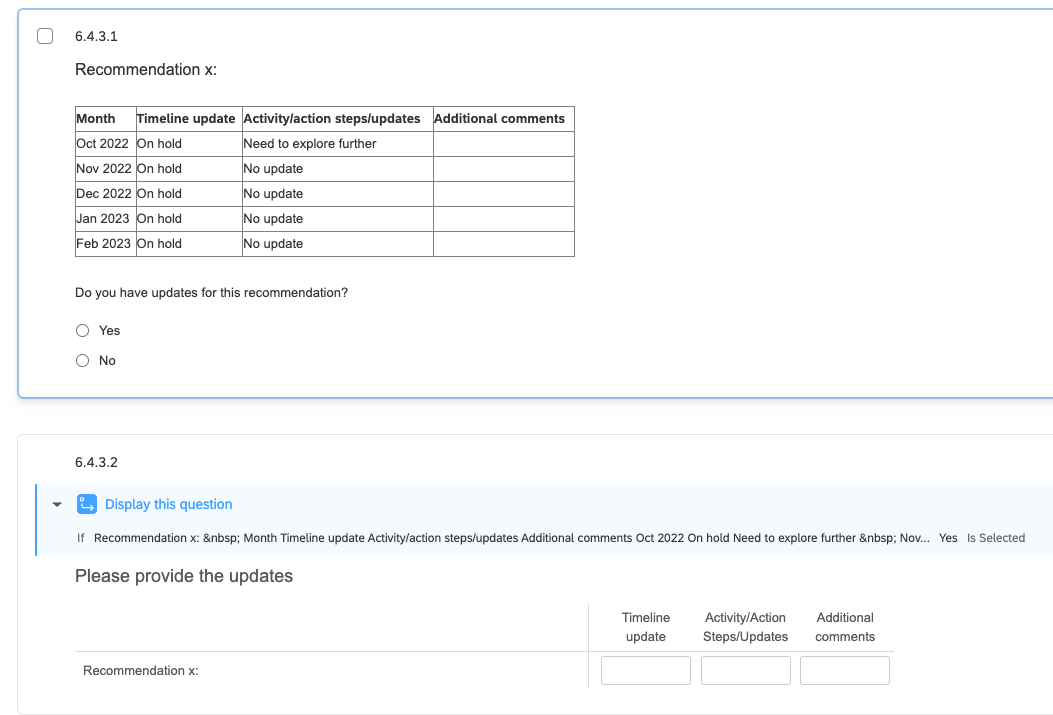
Thanks so much,
Kayleigh

adding historical data to a table each month


Embedded data is on the right track... there is a way to accomplish this, but it's not going to be automatic.
You will want to have the answers to these questions in the Embedded data of the survey. So after that block in your survey, have the survey flow capture that embedded data. Because you want to display several months worth of data, this flow will need to be updated each month - you want to capture answers from January (January_TimelineUpdate, January_ActivityUpdate, January_Comments).
That data then needs to be associated with that contact. Utilize the "contact list trigger" function: https://www.qualtrics.com/support/survey-platform/survey-module/survey-tools/contact-list-triggers/
Then, February's questionaire needs to be updated. Edit the survey project so that the table pulls in that embedded data to display.
It's possible- but it will require monthly project edits on your part.

Userlevel 5
 +22
+22
Could you use a dashboard instead to view the historical data? Use the survey to continue to receive the responses, but use a dashboard that will show the updated response based on how you have it set up?
Different scenario, but we have pulse surveys that the same questions are asked multiple times a year and the responses are set up for those time periods in the dashboard. (Fall, winter, Spring….Jan, Feb, March, etc.) When someone logs into the dashboard, completed survey data points display and if they haven’t happened yet they still remain at zero or “no data to display”.
Leave a Reply
Enter your E-mail address. We'll send you an e-mail with instructions to reset your password.