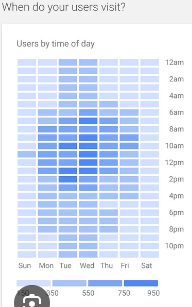
Is it possible to create an attendance grid like below in a results page or dashboard? My data has the day of the week and month and number of attendees.


 +2
+2
Is it possible to create an attendance grid like below in a results page or dashboard? My data has the day of the week and month and number of attendees.
Hi
mabey this will help you
Here's a general approach you can take:
Prepare your data: Make sure your data includes columns for the day of the week, month, and number of attendees.
Embed a custom HTML table: You can embed a custom HTML table in a Qualtrics results page or dashboard. You'll need to write HTML and possibly JavaScript code to generate the table dynamically based on your data.
// Sample data (replace this with your actual data)

var attendanceData = [

    { dayOfWeek: 'Monday', month: 'January', attendees: 25 },

    { dayOfWeek: 'Tuesday', month: 'January', attendees: 30 },

    // Add more data entries as needed

];
// Function to generate the attendance grid HTML

function generateAttendanceGrid(data) {

    var html = '<table><thead><tr><th>Day of the Week</th><th>Month</th><th>Attendees</th></tr></thead><tbody>';
    data.forEach(function(entry) {

        html += '<tr><td>' + entry.dayOfWeek + '</td><td>' + entry.month + '</td><td>' + entry.attendees + '</td></tr>';

    });
    html += '</tbody></table>';

    return html;

}
// Function to insert the attendance grid into a specified element

function insertAttendanceGrid(gridHtml, elementId) {

    var targetElement = document.getElementById(elementId);

    if (targetElement) {

        targetElement.innerHTML = gridHtml;

    } else {

        console.error('Element with ID ' + elementId + ' not found.');

    }

}
// Generate the attendance grid HTML

var attendanceGridHtml = generateAttendanceGrid(attendanceData);
// Insert the attendance grid into a specified element (replace 'targetElementId' with the actual ID of the element)

insertAttendanceGrid(attendanceGridHtml, 'targetElementId');
In this code:
attendanceData array with your actual attendance data.generateAttendanceGrid function takes the attendance data and generates HTML for the attendance grid.insertAttendanceGrid function inserts the generated HTML into a specified element on the page, identified by its ID.Make sure to replace 'targetElementId' with the actual ID of the element where you want to insert the attendance grid.
Use data visualization tools: Qualtrics offers integration with various data visualization tools like Tableau, which can be used to create more complex and interactive attendance grids. You can prepare your data in a format suitable for the visualization tool and embed the visualization in your Qualtrics dashboard.
Utilize Qualtrics reporting features: Qualtrics itself provides reporting features that can display data in tables and charts. While it might not be as customizable as embedding custom code or using external tools, it can still be useful for basic reporting needs.
+2
If I’m reading this correctly, would I need to update the data manually everyday?
Yes
Enter your username or e-mail address. We'll send you an e-mail with instructions to reset your password.

