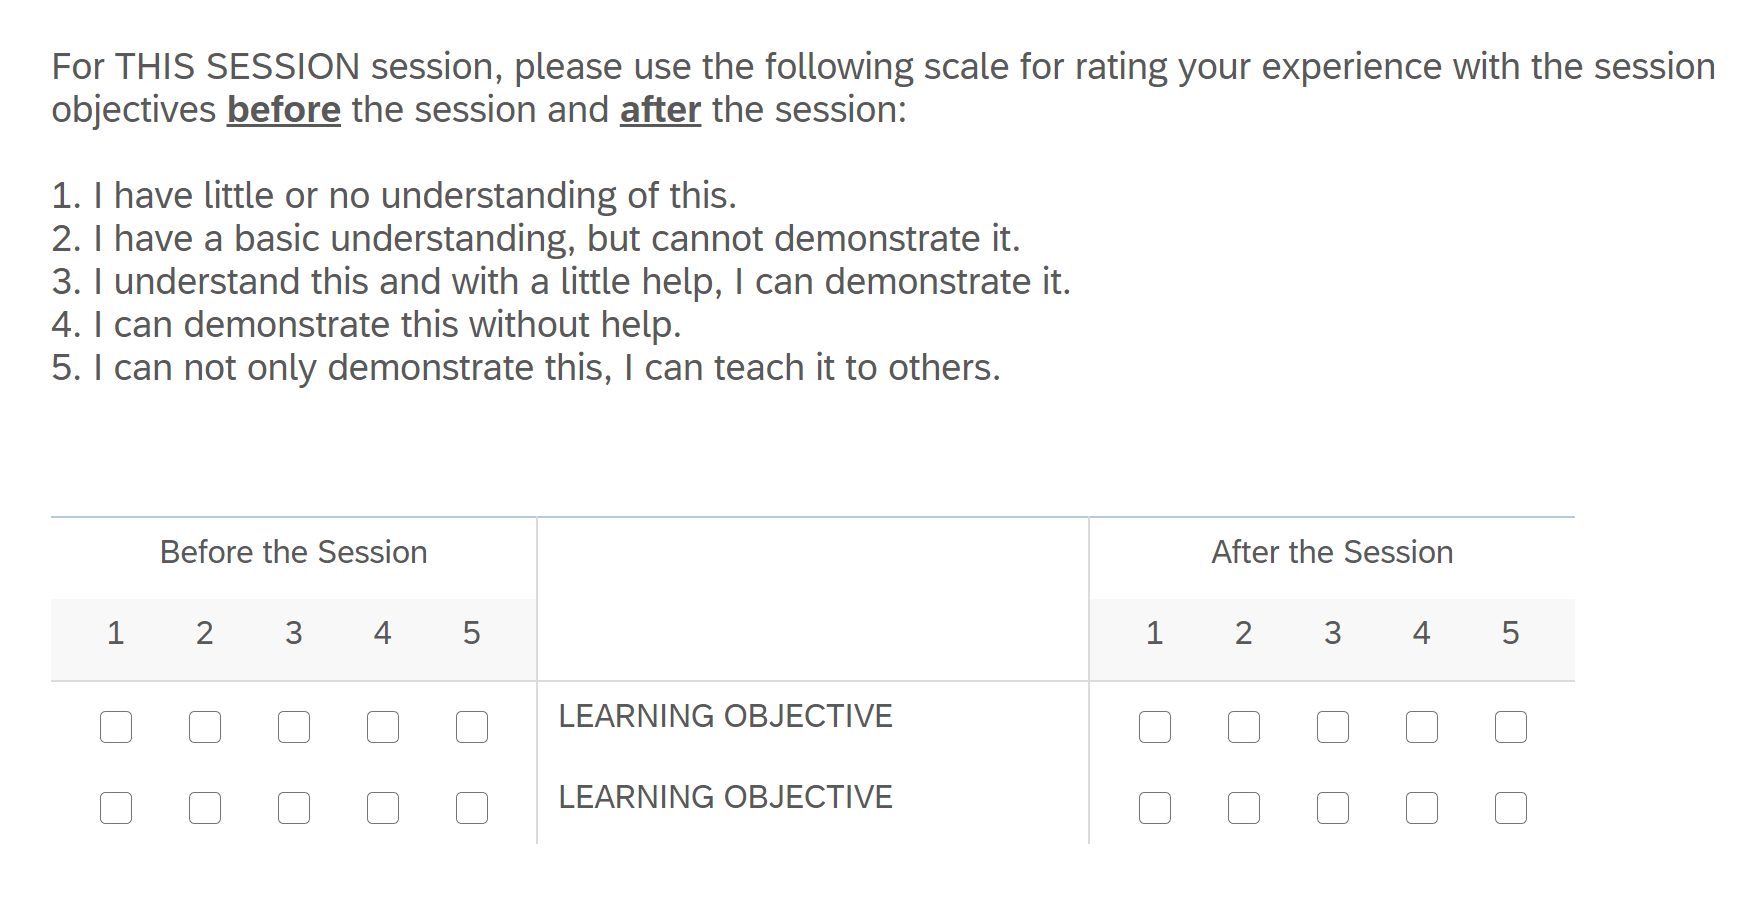
Hello! I am hoping the community minds here might have a solution to our issue. We have a standard question that we need to use in many evaluations for evaluating knowledge before and after education. The question itself LOOKS amazing and we get very high response rates on it because its so easy to fill out.
HOWEVER - the problem is that when we go to do the reporting for these questions, we have to manually download the numbers for the before and after and then calculate the statistics, and then make a custom format to put them together in an executive-friendly manner.
So all of this work is rather taxing on the reporting side, and I am trying to see if there is any way that I can improve the process. Do you guys have any thoughts? Changing the question type, an easier way to calculate the stats, an easier way to do the reporting - I'm all ears! :-)
I have included a question and the reporting example below to make it easier to see what I'm talking about.
Question Example: Output with added calculation for mean statistic:
Reporting after all the work is done:
I'm not sure if I fully understand the constraints of your set-up. Specifically, where is your output coming from? Is that something you've created from a data export or report export?
One thought would be to just switch to a matrix item for the before ratings and a matrix item for the after ratings. It won't look quite as elegant, but it captures the same thing and might be easier to plug into your report.
More of a methodological thought...I'm also curious why you wouldn't collect the before ratings before the session? I'd argue that having respondents assess at that actual point in time would be a more accurate measure.
Hi Clair!
Right now, I'm doing a report output to get all the questions and an output table for these questions, and then moving the numbers from that table to Excel and using a formula to capture the mean, because I can't seem to get a stats table out of these matrix questions. Then I transfer those means back into a custom table setup inside the report output.
Great methodological question! We actually send these out in the morning before sessions and encourage users to add their numbers right away to the before side, and then spend time in the afternoon with them on filling out the after side.
But you've got my brain ticking on this now - a separate survey in the morning would mean I could change the question type and get the stats calculated for the befores, and then a separate survey in the afternoon would mean the same. So that is more surveying but less work overall? I have to ponder this!
cphillipps ClairJ I'm not sure that it's an issue with your question, since gap analysis of understanding before and after a session is a great way to assess training effectiveness. I think if you present data in a simpler way, that might help you get your point across using the data that you already have.
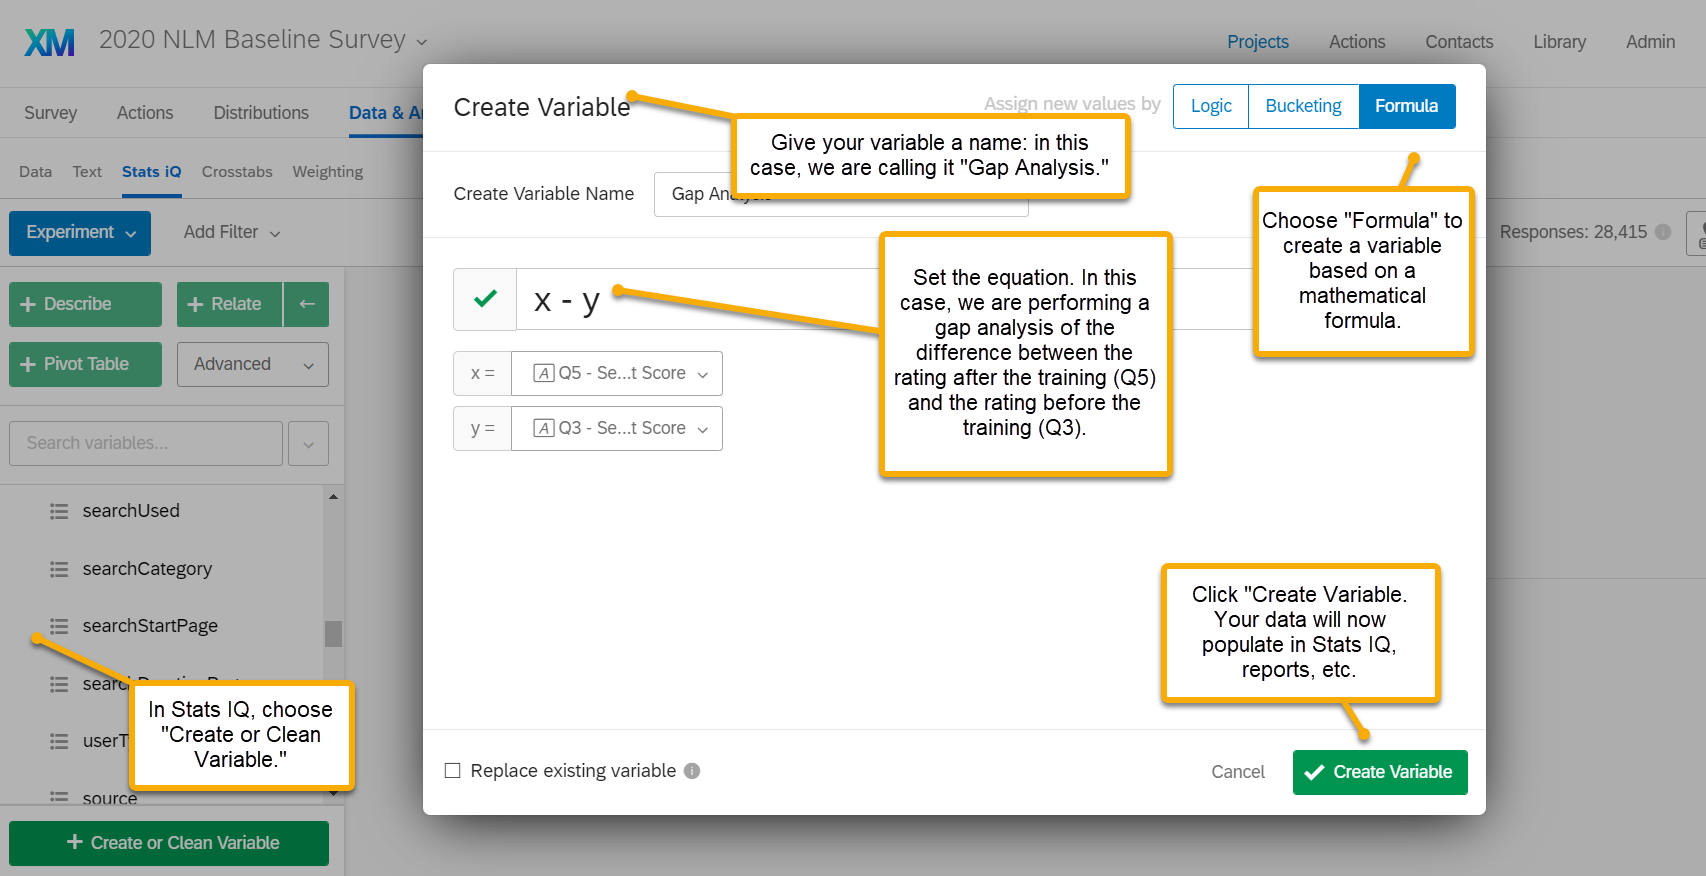
Would a good outcome for you be that the average compliance/legal affairs trainiee moved two points upward (e.g., from a 2 to a 4 rating)? If that's the case, you could create a custom field that would subtract the before-training response from the after-training response. An average gap of zero would reflect no change, below zero would reflect a decline in understanding, above zero would show an increase. You could also show the rating after training to provide a current state.
Here's how to do it in Stats IQ: is that what you are looking for?
AdamK12 oh my gosh, that would be awesome ... if I had StatsIQ, dang it! We just have the use of the main platform.
cphillipps I see--that makes sense! The same principle would apply for any stats or analysis program that you're using. In Excel, just create a separate column and use the sigma function to subtract the before session figure from the after session figure for each respondent and that will give you a data set. You can do the same thing in Tableau with calculated fields, if you use that as well.
I hope that helps!
cphillipps
You could definitely send out a separate survey in the morning for respondents to submit their "before" scores. If you want to be able to match their data to the "after" scores recorded later, then you could include some embedded data with a respondent ID (whatever that may be for you), and send out unique links. You can also use embedded data to tell you if the survey was taken pre- or post-session. I do think that's a good option for the methodology, if you think it'd work for you!
As far as calculations go, I think you can do that without Stats IQ. I think it would be easier to do the calculation within Qualtrics if the pre- and post-session scores are in the exact same survey response - so basically the way you have them take the survey now. To do the calculations, you could either use embedded data and piped text in your survey flow or create a calculation afterwards.
To use embedded data and piped text: Set an embedded data field in your survey flow. This embedded data field should come after the block where respondents score the sessions.
Get the piped text for the matrix where you have your pre-session scores. That could be something like:
${q://QID1/ChoiceGroup/SelectedAnswers/1}Get the piped text for the matrix where you have your post-session scores. That could be something like:
${q://QID2/ChoiceGroup/SelectedAnswers/1}The above piped text examples are based on two separate matrices for pre- and post-session scores. If you're using that side-by-side format, it will still work, but your piped text fields would be different. So with that information, the calculation you'd use to set your embedded data would be:
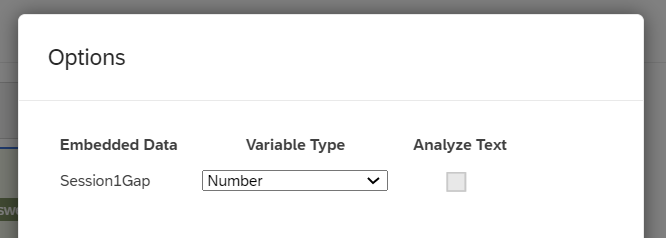
$e{ q://QID2/ChoiceGroup/SelectedAnswers/1 - q://QID1/ChoiceGroup/SelectedAnswers/1 }Make sure you include the spaces in between the { } symbols; I think they're necessary. Here's an example of what that would look like in your survey flow. I called my embedded data field "Session1Gap."
 Then if you click on "options" you can change the embedded data type to a number.
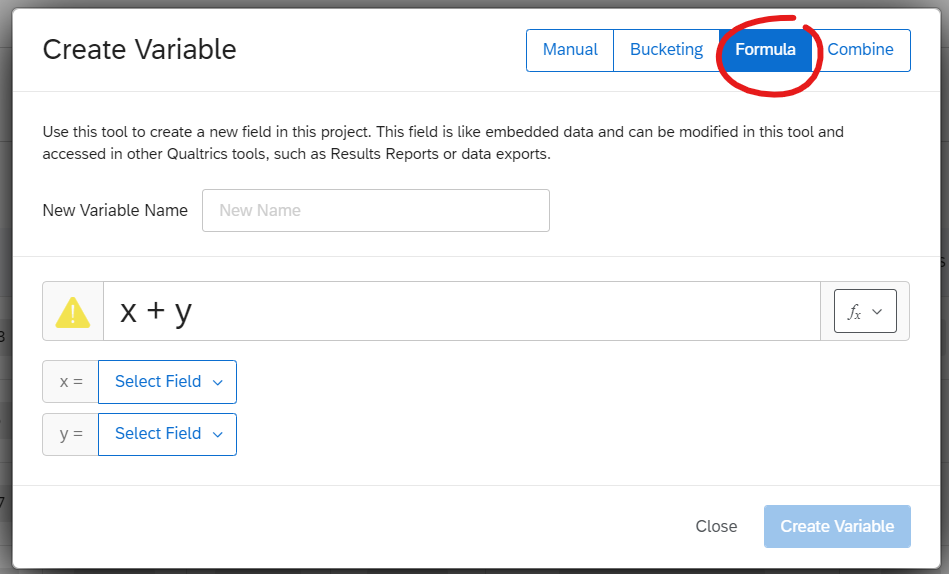
Another option would be to create a new variable in your Data & Analysis tab. This doesn't actually use the StatsIQ tab/feature, but is basically the same thing AdamK12 suggested. I don't think this way of doing it is exclusive for StatsIQ users, but honestly I'm not sure. Go to your Data & Analysis section. In the Data tab, click on "Tools" on the far right. Then click on "Create new field."
 You'll see a screen like the one screenshotted below. Click on the "formula" option and then follow the same steps that AdamK12 suggested previously
Leave a Reply
Enter your E-mail address. We'll send you an e-mail with instructions to reset your password.
