So i've imported about 340 answers into the project in Qualtrics dedicated to do Price Sensitivity Measurement (PSM).
However, when i click "Report", there is no graph showing. Just this error message:
"No data found - your filters may be too exclusive!". Take a look at the attached picture.
Does anyone know what that means? I've cleaned out all the bad values as well. 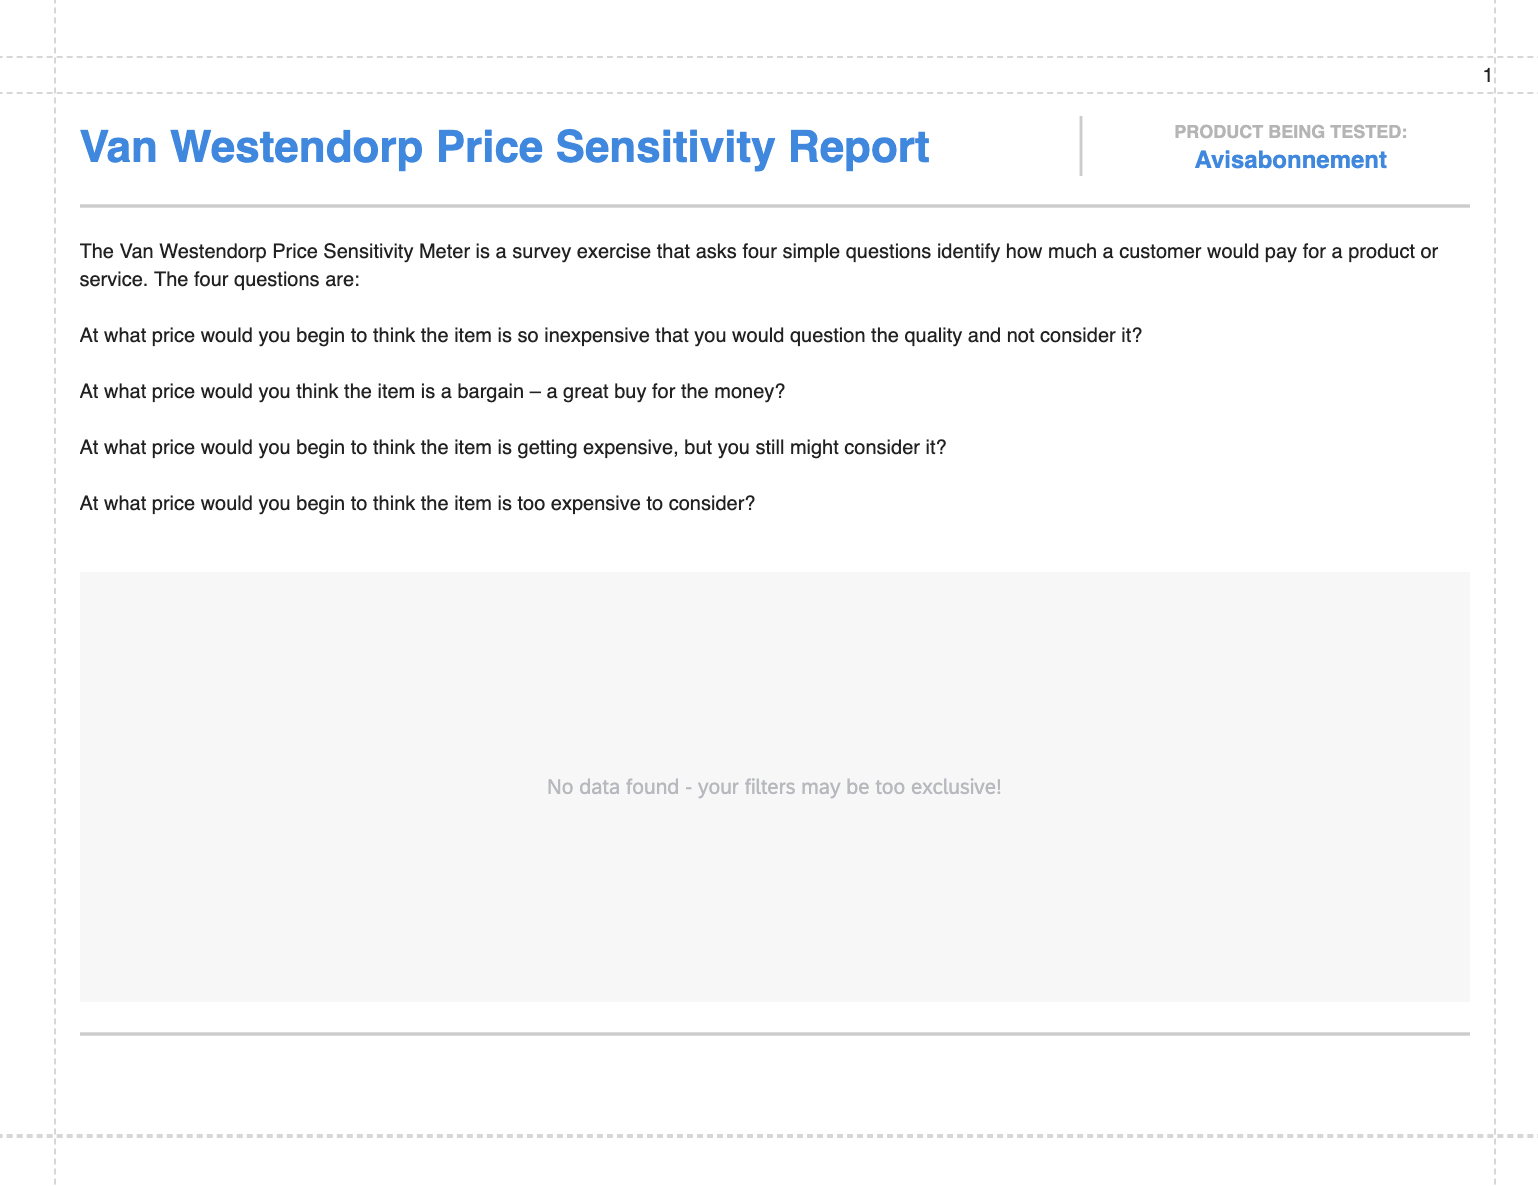

Graph not showing in Pricing Study (Van Westendorp) Project

Userlevel 6
 +21
+21
HI OttoJohnen
To show the data in "Price estimator(Van Westendorp)" visualisations we need to have the data in this Pricing data i.e. all 4 below variables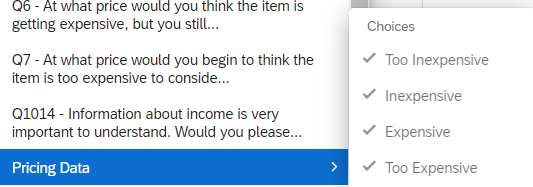

 +4
+4
I'm getting a data error there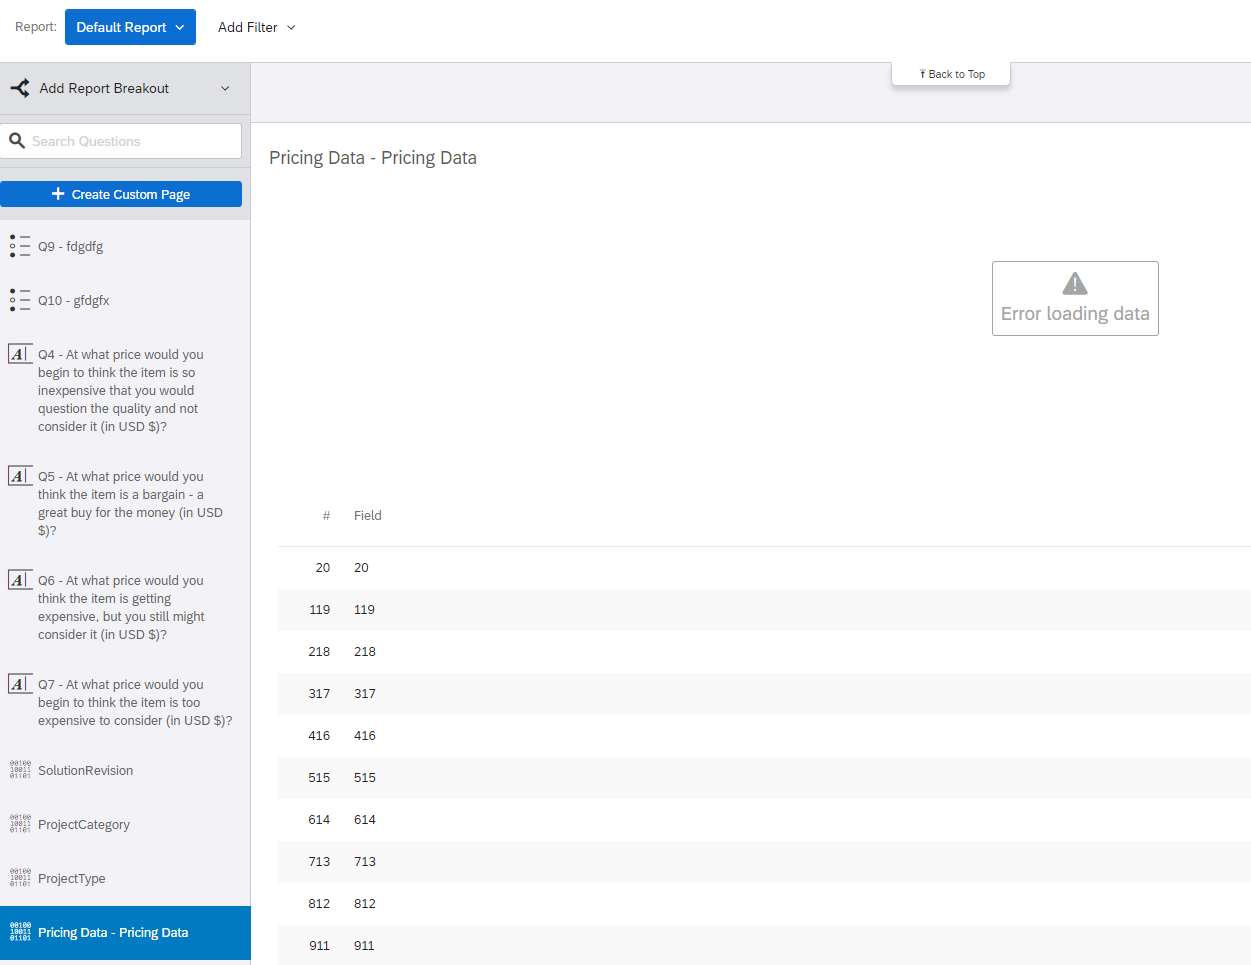

Userlevel 7
 +13
+13
Hi KimB - if you are still experiencing this data error after refreshing your account, be sure to reach out to our Support team so they can further troubleshoot this for you!
Leave a Reply
Enter your username or e-mail address. We'll send you an e-mail with instructions to reset your password.