Hi All,
Regarding the Number Chart Widget and the ability to see a change value. I've read the support page countless times (https://www.qualtrics.com/support/vocalize/widgets/chart-widgets/number-chart-widget/) and tested and tested but I still can't replicate the change numbers it displays.
If anyone else has had the same problem but managed to work out how it works, I'd be grateful for a reply with a few examples.
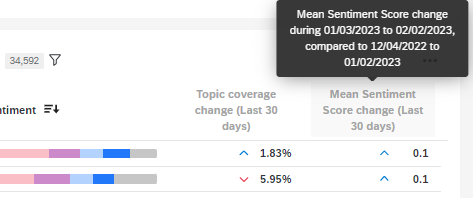
My scenario is that I want to see YTD vs previous month, last 30 days vs month ago and last 14 days vs a week ago (ie they overlap by a week). When it says a week ago, is this 14 days previous week? is this like a shift back by 7 days or by a whole week starting on the Sunday so it might not be a whole week if you are half way through the week.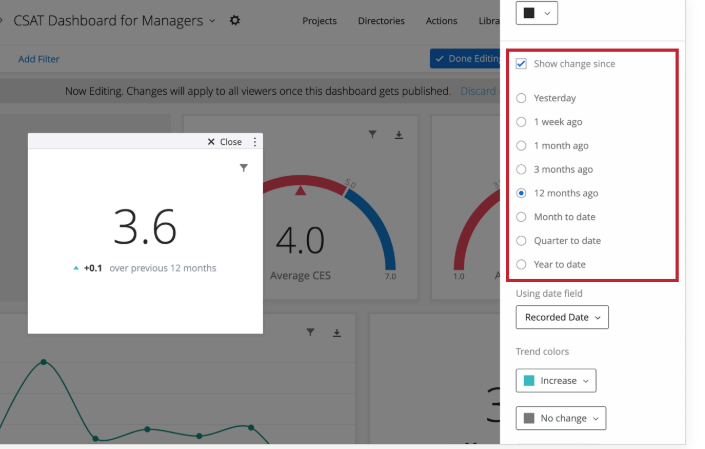 I exported my responses and understand the value is about the number of responses but still couldn't replicate the change numbers.
Many thanks in advance
Rod Pestell
Best answer by LaurenK
View original