

Hi All,
Regarding the Number Chart Widget and the ability to see a change value. I've read the support page countless times (https://www.qualtrics.com/support/vocalize/widgets/chart-widgets/number-chart-widget/) and tested and tested but I still can't replicate the change numbers it displays.
If anyone else has had the same problem but managed to work out how it works, I'd be grateful for a reply with a few examples.
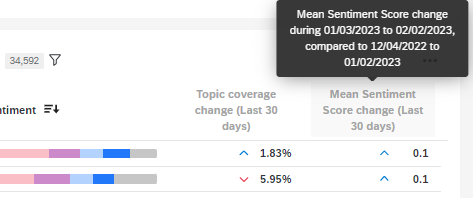
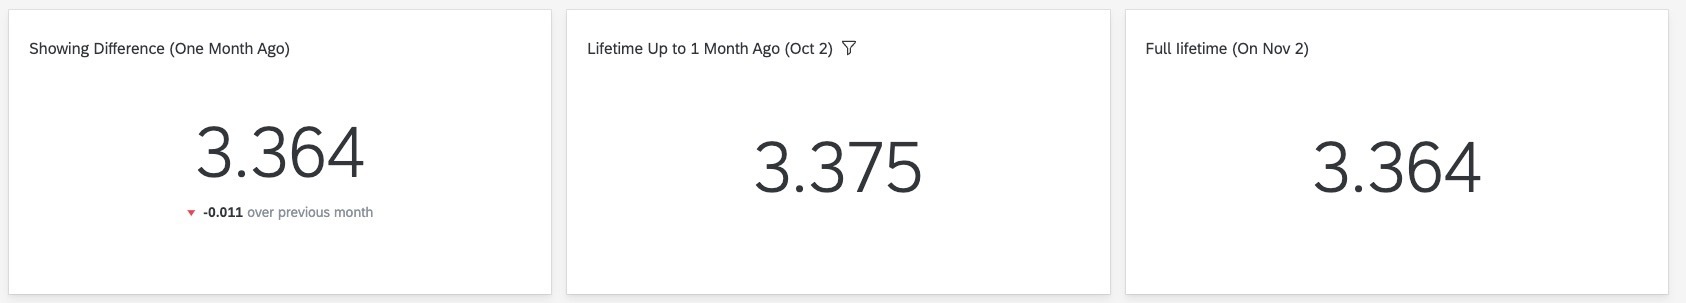
My scenario is that I want to see YTD vs previous month, last 30 days vs month ago and last 14 days vs a week ago (ie they overlap by a week). When it says a week ago, is this 14 days previous week? is this like a shift back by 7 days or by a whole week starting on the Sunday so it might not be a whole week if you are half way through the week.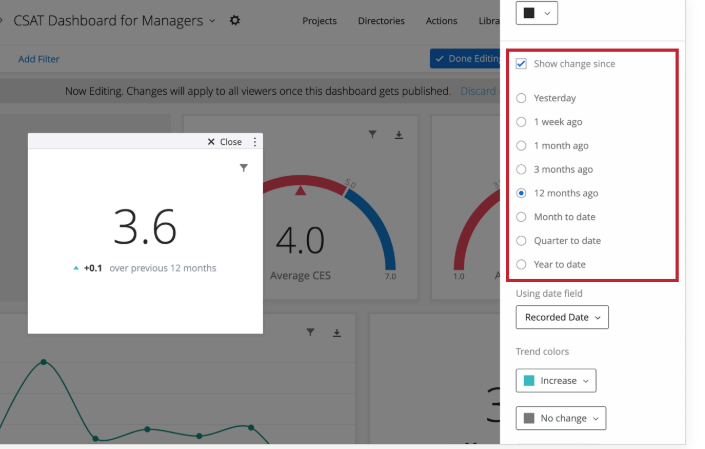 I exported my responses and understand the value is about the number of responses but still couldn't replicate the change numbers.
Many thanks in advance
Rod Pestell

Number Chart Widget (CX), can't replicate the change number during checks
Best answer by LaurenK
Hi Rod_Pestell! We reached out to our Support team about this one and they let us know that the dates function on a rolling basis. So, if it says a week ago, it would be information on the last 7 days (shift back 7 days). They otherwise recommended reviewing the following Qtip on this Support page:
"Show Change Since is a rolling calculation because the included data is relative to the current date. For example, let’s say you configure the widget to Show Change Since 1 week ago. If you look at the widget on January 8, the displayed numerical value will show you how the data has changed since January 1. If you then look at the widget on January 31, the displayed numerical value will show you how the data has changed since January 24."
If you have any additional questions, be sure to reach out to our wonderful Support team! 😀


Enter your E-mail address. We'll send you an e-mail with instructions to reset your password.