here's a screenshot of the table:
!
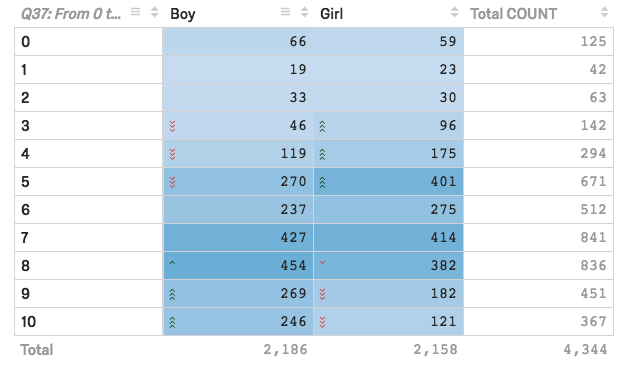
Is there a way to show the p-values alongside the other data in this table?
Best answer by KendraR
View original
 +2
+2
Best answer by KendraR
View original
 +13
+2
+13
+2
") . In the future, I would recommend that, unless your response actually solves the problem, you not mark the question as answered. Thanks!
. In the future, I would recommend that, unless your response actually solves the problem, you not mark the question as answered. Thanks!
 +11
+2
+11
+2

 +33
+2
+2
+33
+33
+2
+2
+33
Enter your username or e-mail address. We'll send you an e-mail with instructions to reset your password.