 Is there a way to show the p-values alongside the other data in this table?
Solved
Show stats on pivot table
 +2
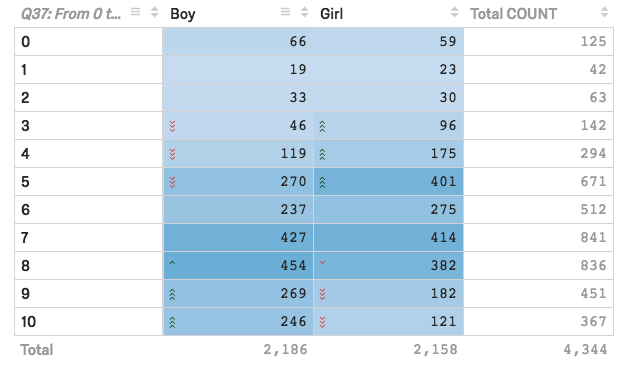
+2I have a pivot table that shows how boys compared to girls on a self-rating scale of 0-10. Stats-IQ shows me that several of the differences between the two groups are statistically significant. I'd like to be able to show the p-values in the same table so that the degree of significance is a little clearer and allow the readers to see and judge for themselves about the level of significance. But I can't seem to find a way to show the statistics in the same table. They're obviously available, since Qualtrics based it's decision on whether to mark it significant or not would have been based on running those stats. It would also be nice to be able to change or at least report which test was run.
here's a screenshot of the table:
!
Is there a way to show the p-values alongside the other data in this table?
Is there a way to show the p-values alongside the other data in this table?Best answer by KendraR
Hi, @Peter! If you have not yet already, I’d recommend posting this in our Product Ideas category, as it is a feature not already developed by our team. Be sure to review the How to Write a Good Product Idea template and our Ideation Guidelines before you post your idea!


Sign up
Already have an account? Login

Welcome! To join the Qualtrics Experience Community, log in with your existing Qualtrics credentials below.
Confirm your username, share a bit about yourself, then you're ready to explore and connect .
Free trial account? No problem. Log in with your trial credentials to join.
No free trial account? No problem! Register here
Already a member? Hi and welcome back! We're glad you're here 🙂
You will see the Qualtrics login page briefly before being taken to the Experience Community.
Login with Qualtrics
Welcome! To join the Qualtrics Experience Community, log in with your existing Qualtrics credentials below.
Confirm your username, share a bit about yourself, then you're ready to explore and connect .
Free trial account? No problem. Log in with your trial credentials to join. No free trial account? No problem! Register here
Already a member? Hi and welcome back! We're glad you're here 🙂
You will see the Qualtrics login page briefly before being taken to the Experience Community.
Login to the Community
Welcome! To join the Qualtrics Experience Community, log in with your existing Qualtrics credentials below.
Confirm your username, share a bit about yourself, then you're ready to explore and connect .
Free trial account? No problem. Log in with your trial credentials to join.
No free trial account? No problem! Register here
Already a member? Hi and welcome back! We're glad you're here 🙂
You will see the Qualtrics login page briefly before being taken to the Experience Community.
Login with Qualtrics
Welcome! To join the Qualtrics Experience Community, log in with your existing Qualtrics credentials below.
Confirm your username, share a bit about yourself, then you're ready to explore and connect .
Free trial account? No problem. Log in with your trial credentials to join. No free trial account? No problem! Register here
Already a member? Hi and welcome back! We're glad you're here 🙂
You will see the Qualtrics login page briefly before being taken to the Experience Community.
Enter your E-mail address. We'll send you an e-mail with instructions to reset your password.