Starting March 31, we’re updating the visual design of simple chart widgets for all dashboard users. We want to ensure consistent information design and begin to add accessibility compliance so that we can eventually meet WCAG 2.0 AA. The first stage of accessibility is improving the colors and contrast ratios of the default charts.
Here are a few of the changes we’re introducing:
Line chart updates
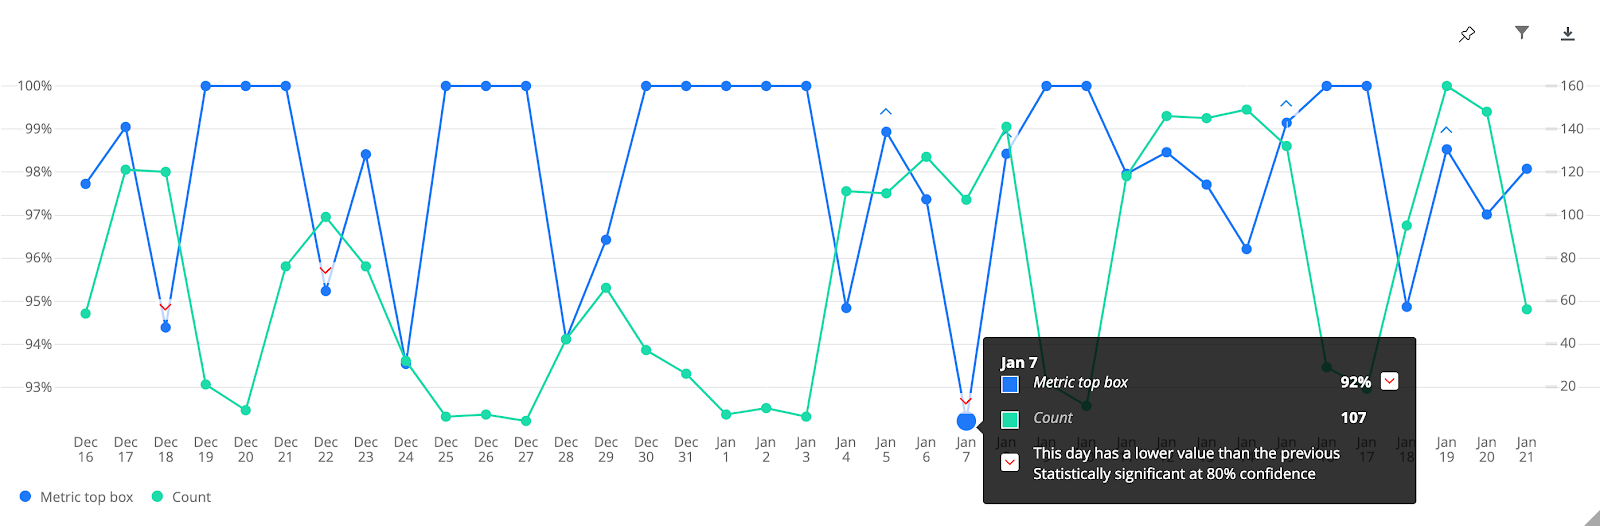
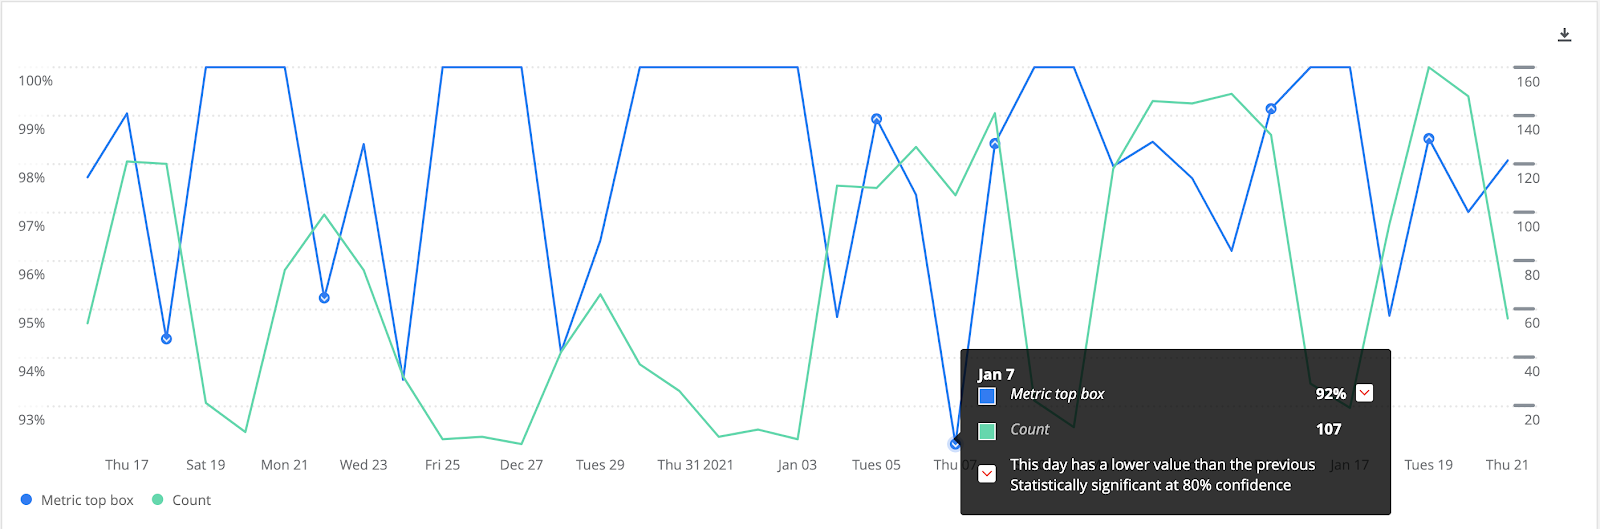
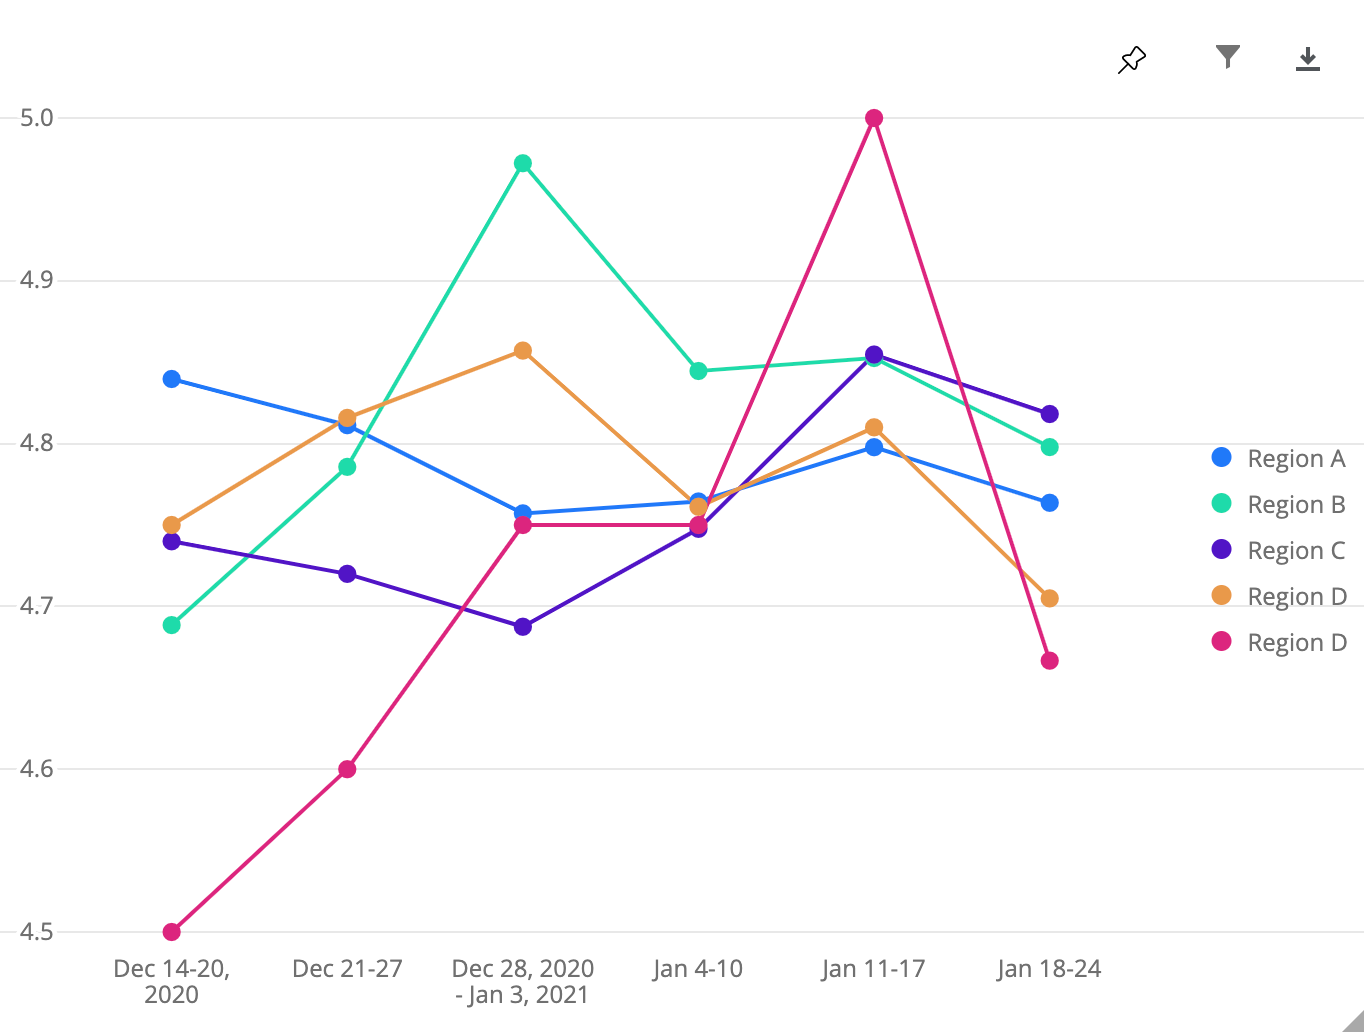
Points are removed and will only be rendered on hover and when data needs a special indicator; for example, statistical significance, grouped for anonymity (EX), or low sample size (this last one is an upcoming feature). This reduces visual noise in the line chart.
Before
After
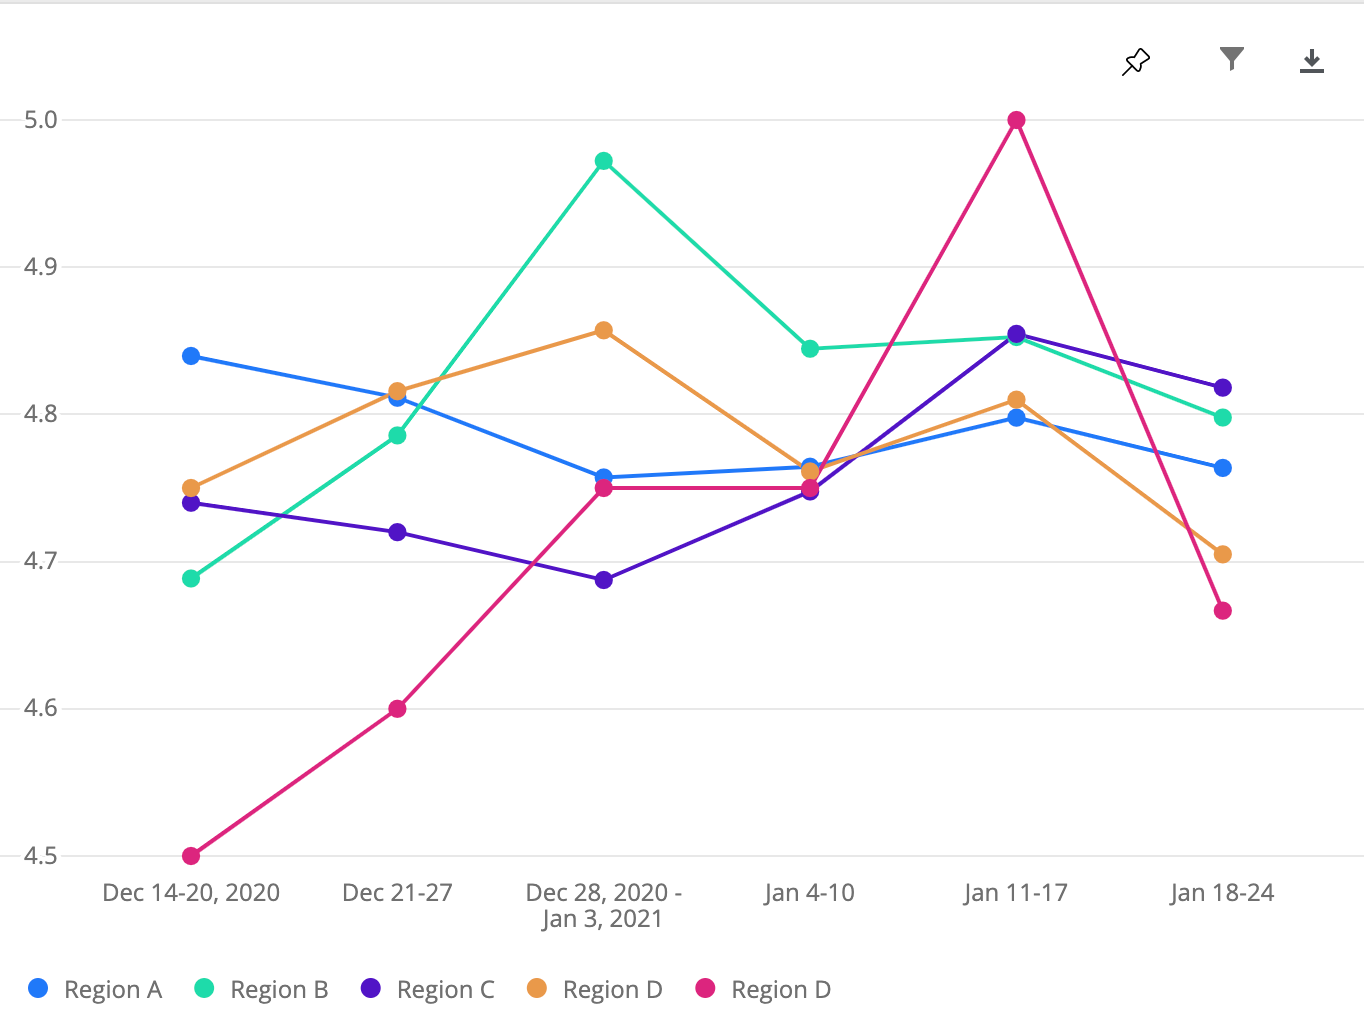
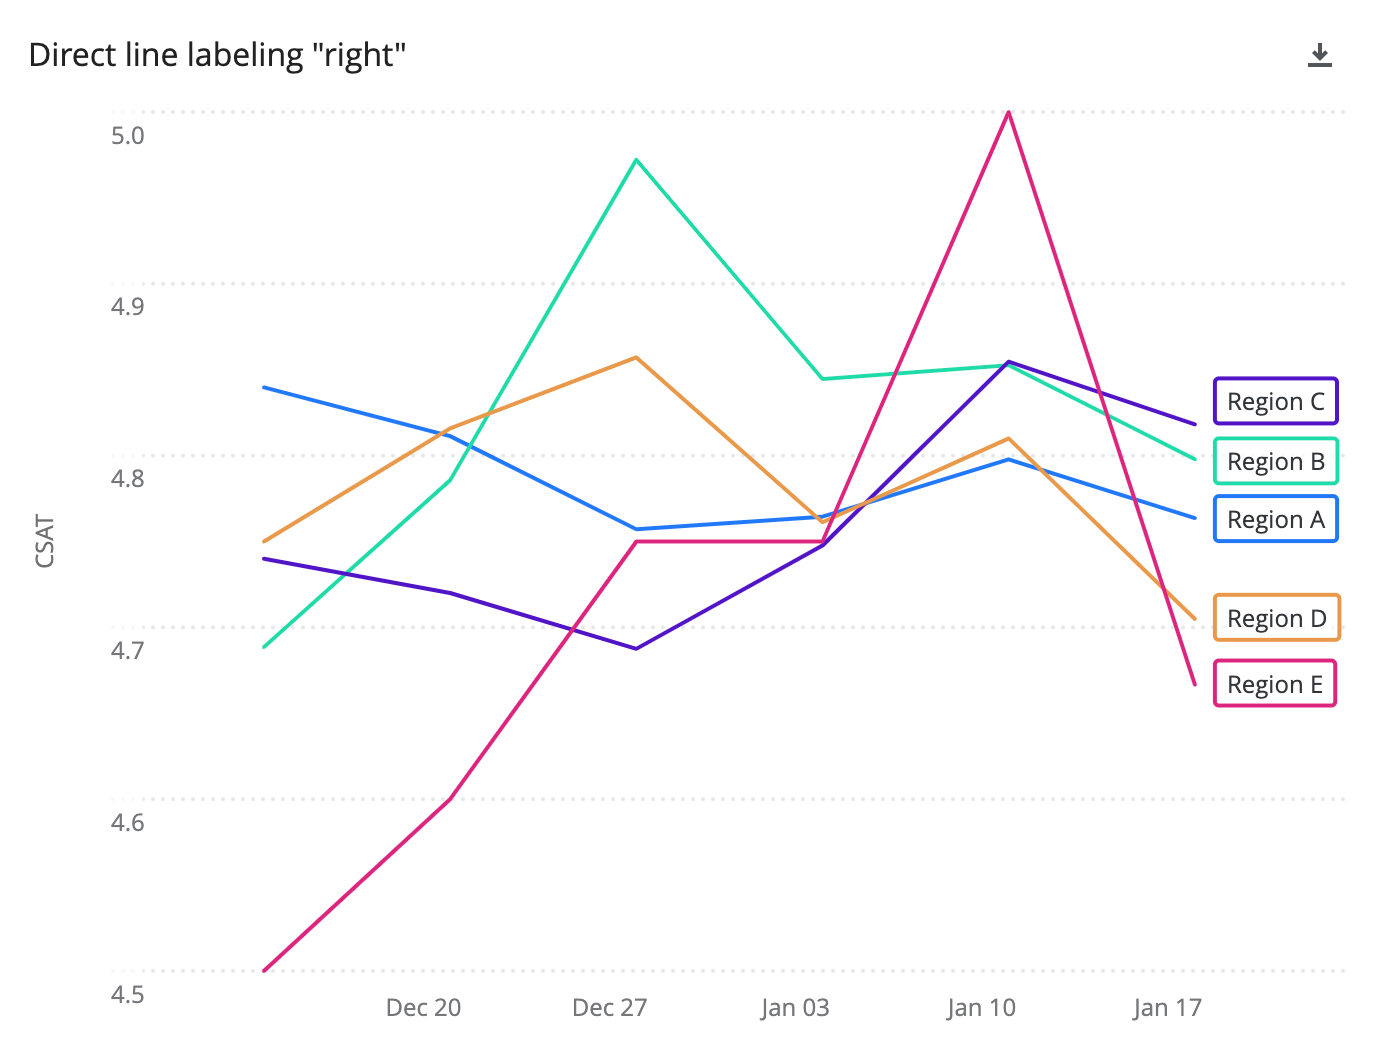
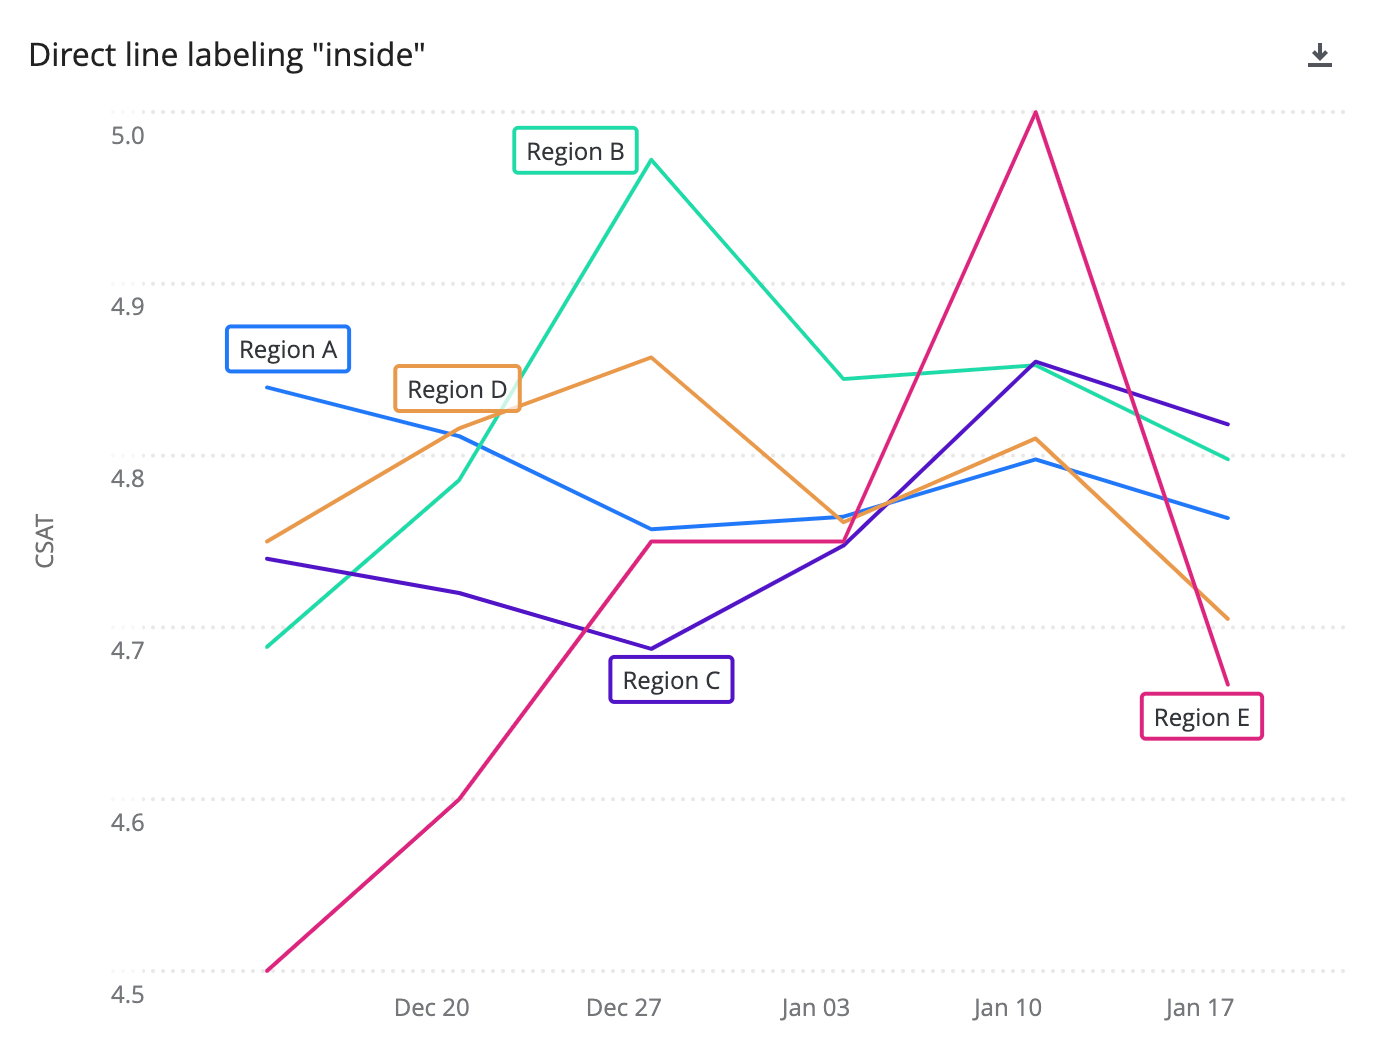
We’ll also be introducing direct line labeling, a visualization technique based on the Gestalt principle of proximity – namely, the idea that viewers will perceive objects that are in close proximity to each other as being more meaningfully grouped or connected. Traditional legends undercut this principle, forcing viewers to draw connections often over much larger distances, resulting in increased cognitive effort. Direct labeling also benefits any viewers that experience challenges interpreting colors, as establishing connections between lines and labels is no longer dependent on color only.
This option is available when chart legend is configured in position “right” as well as a new “inline” option to position labels inside the chart area.
Before – legend position “bottom”
 Before – legend position “right”
 After – legend position “right”
 After – legend position “inside”
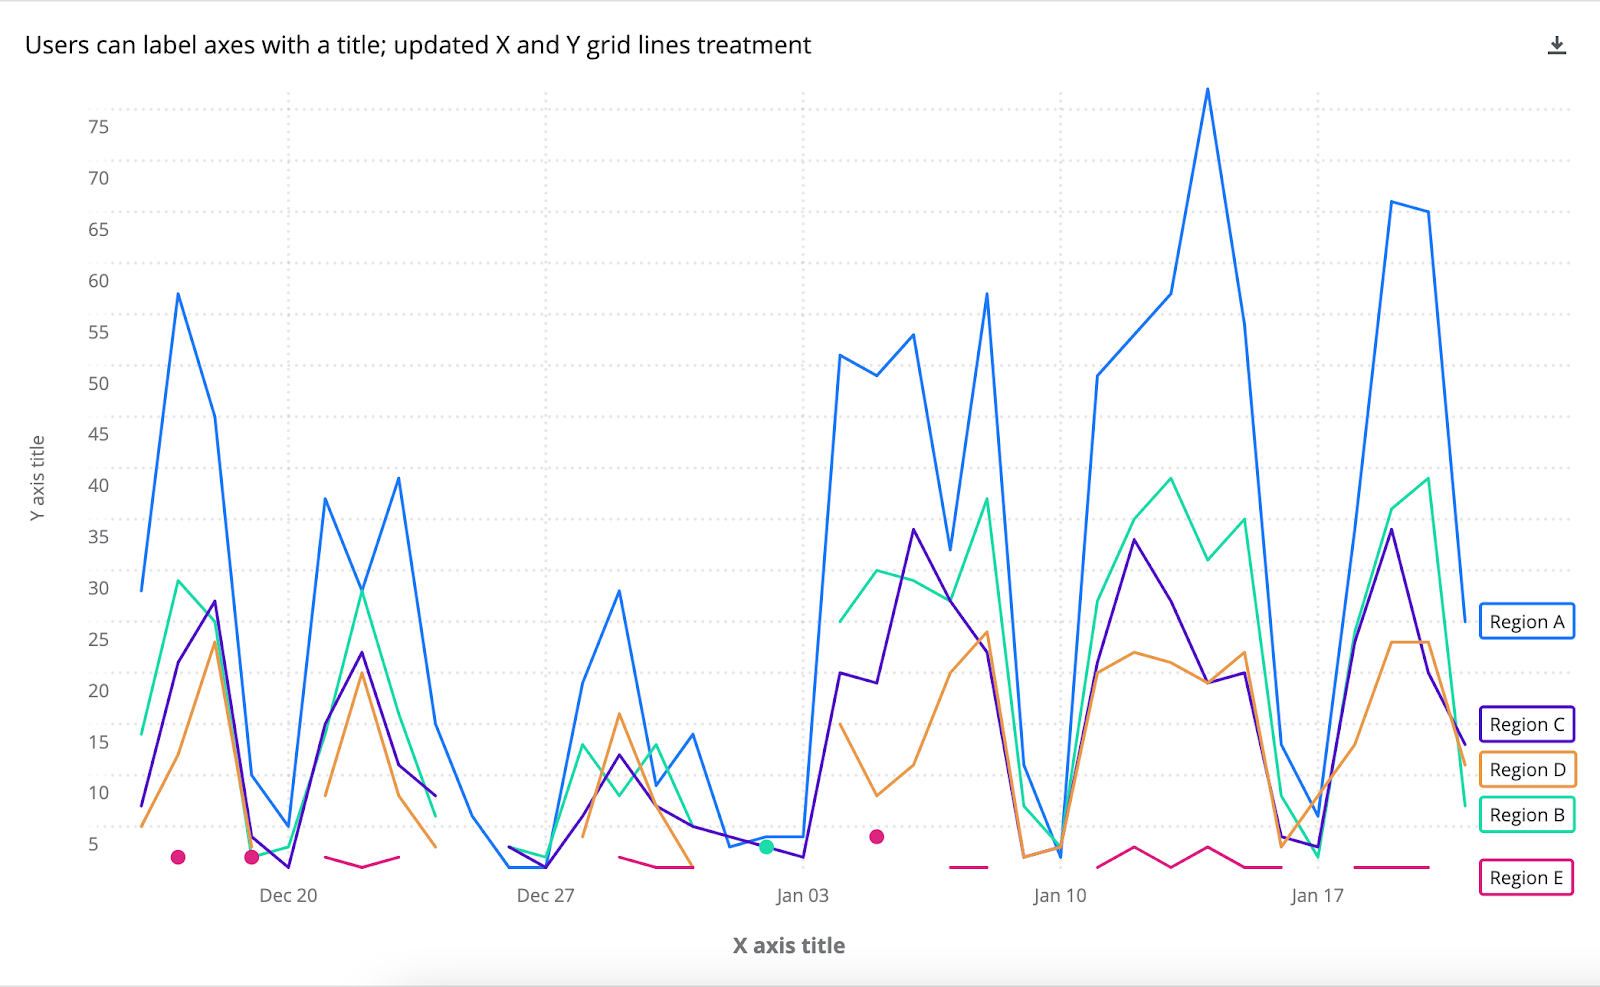
We’re introducing axis titles, a new feature that allows users to label their X and Y axes with a title to provide additional context for their data and, in many cases, remove the need for a legend.
In addition, X and Y grid line treatments are now toned down to reduce noise in the chart.
Before
 After
After
 We’re introducing a new feature called lines of interest, where users can interact and explore multiple data series of interest by hovering and selecting line labels to focus and defocus them on the chart.
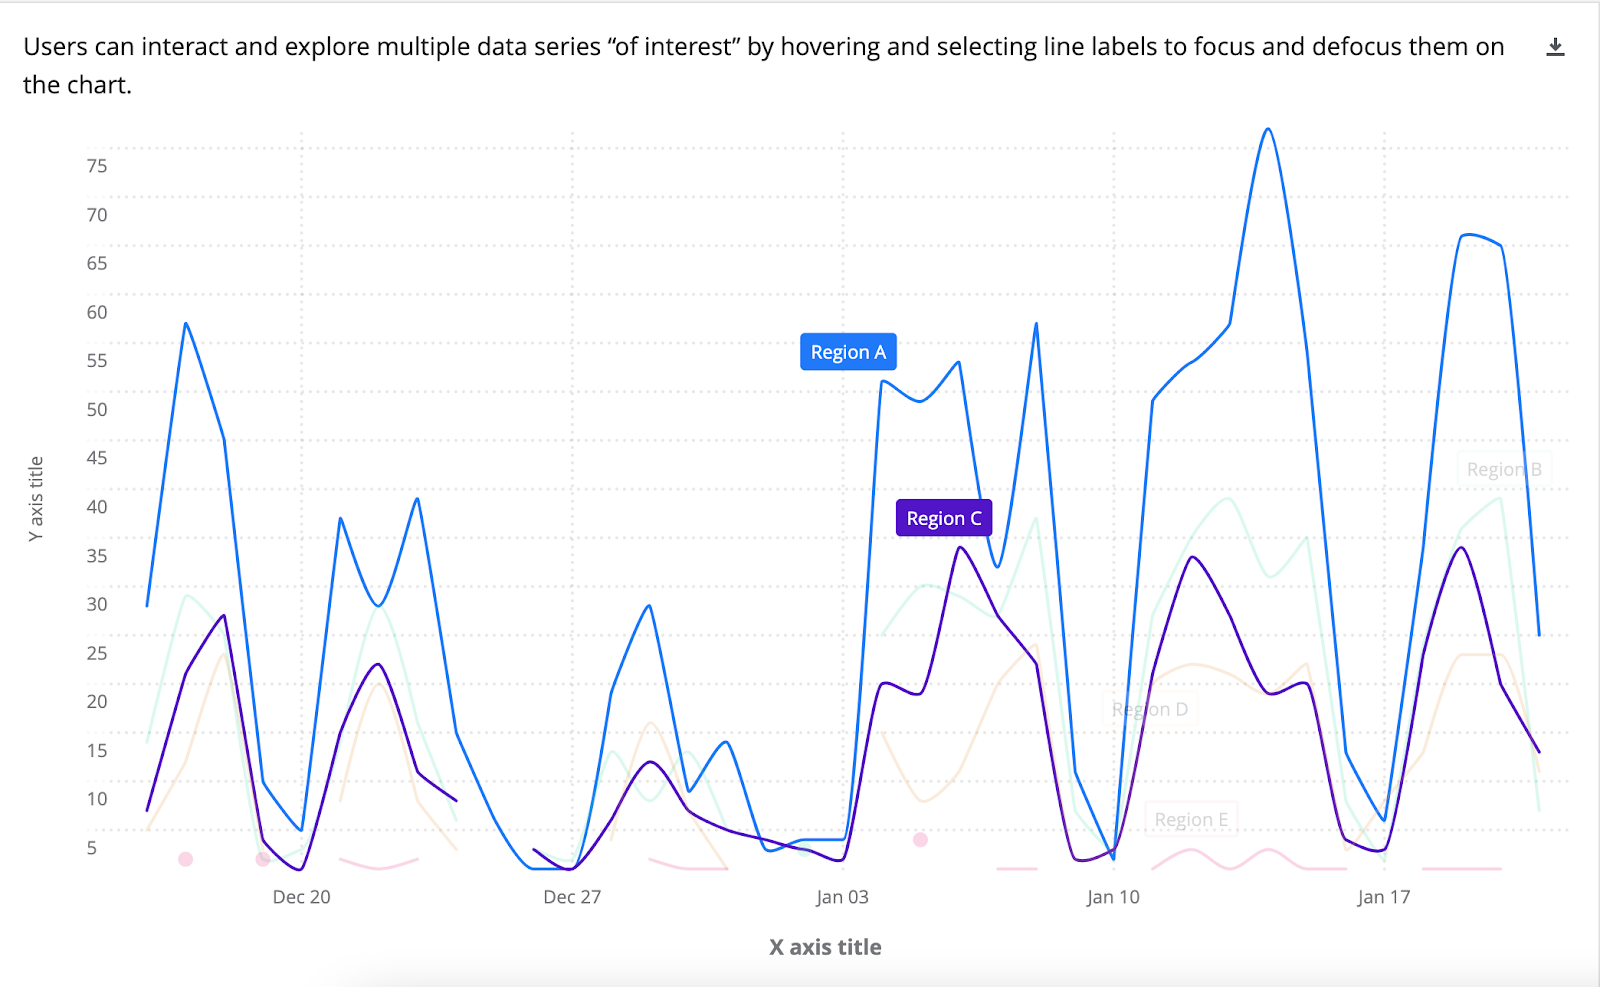
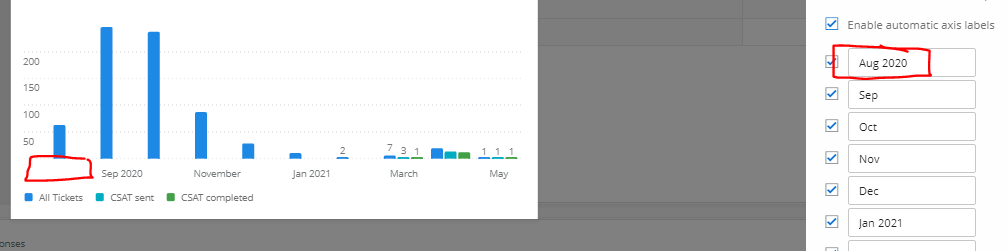
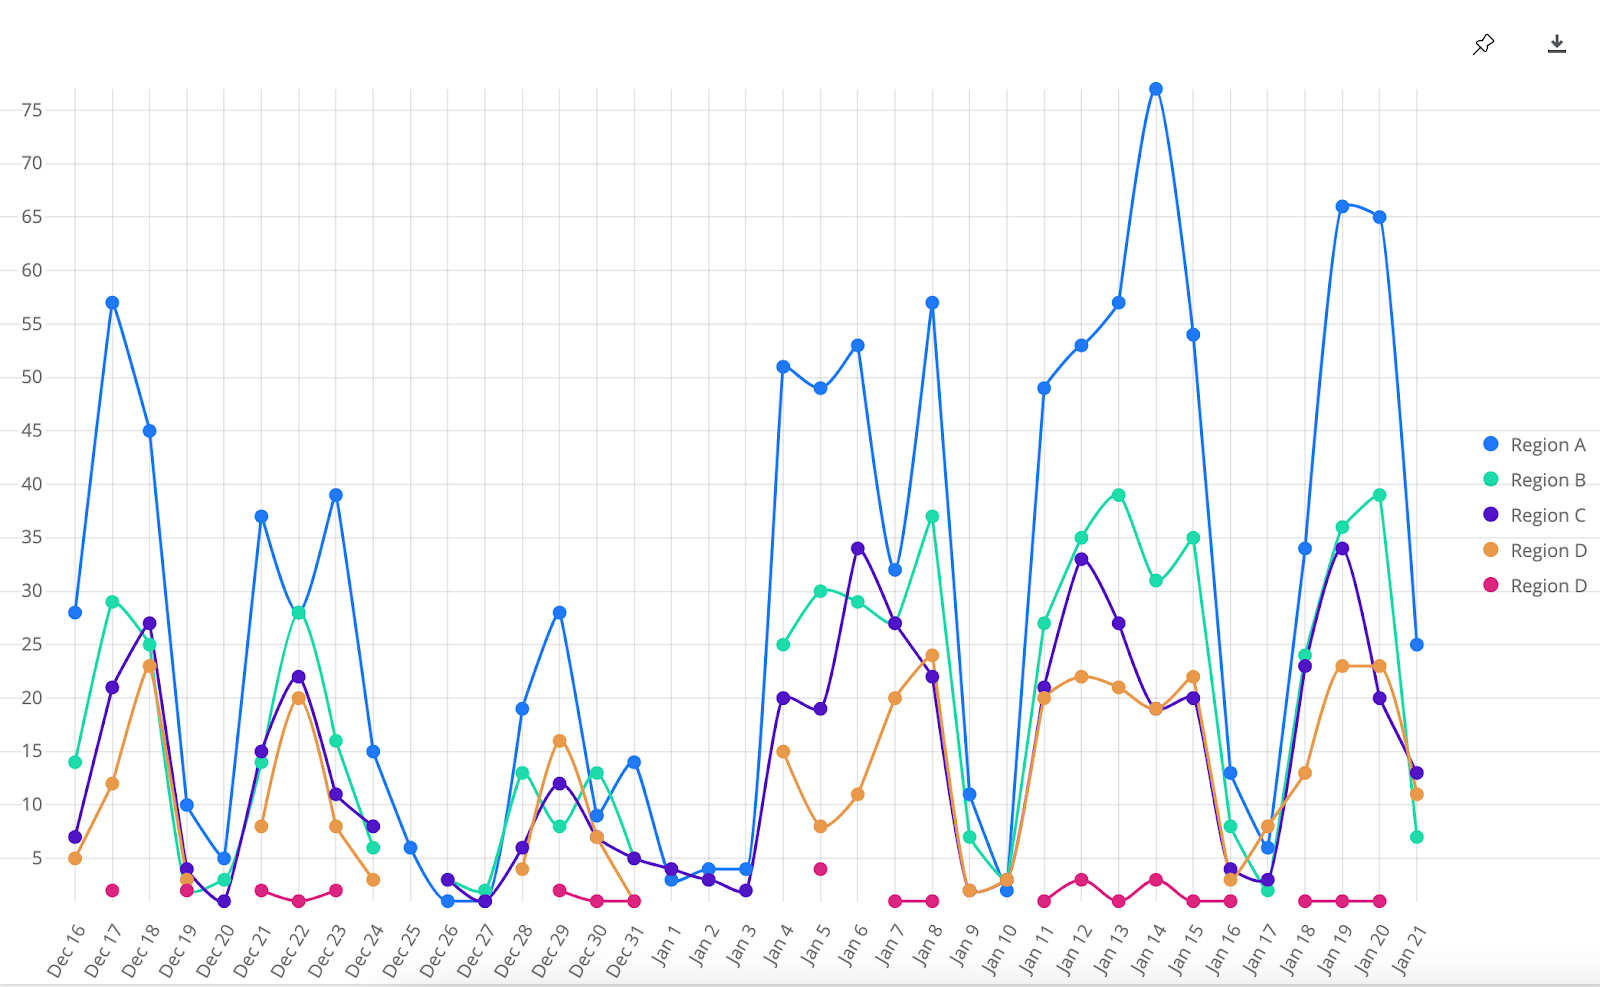
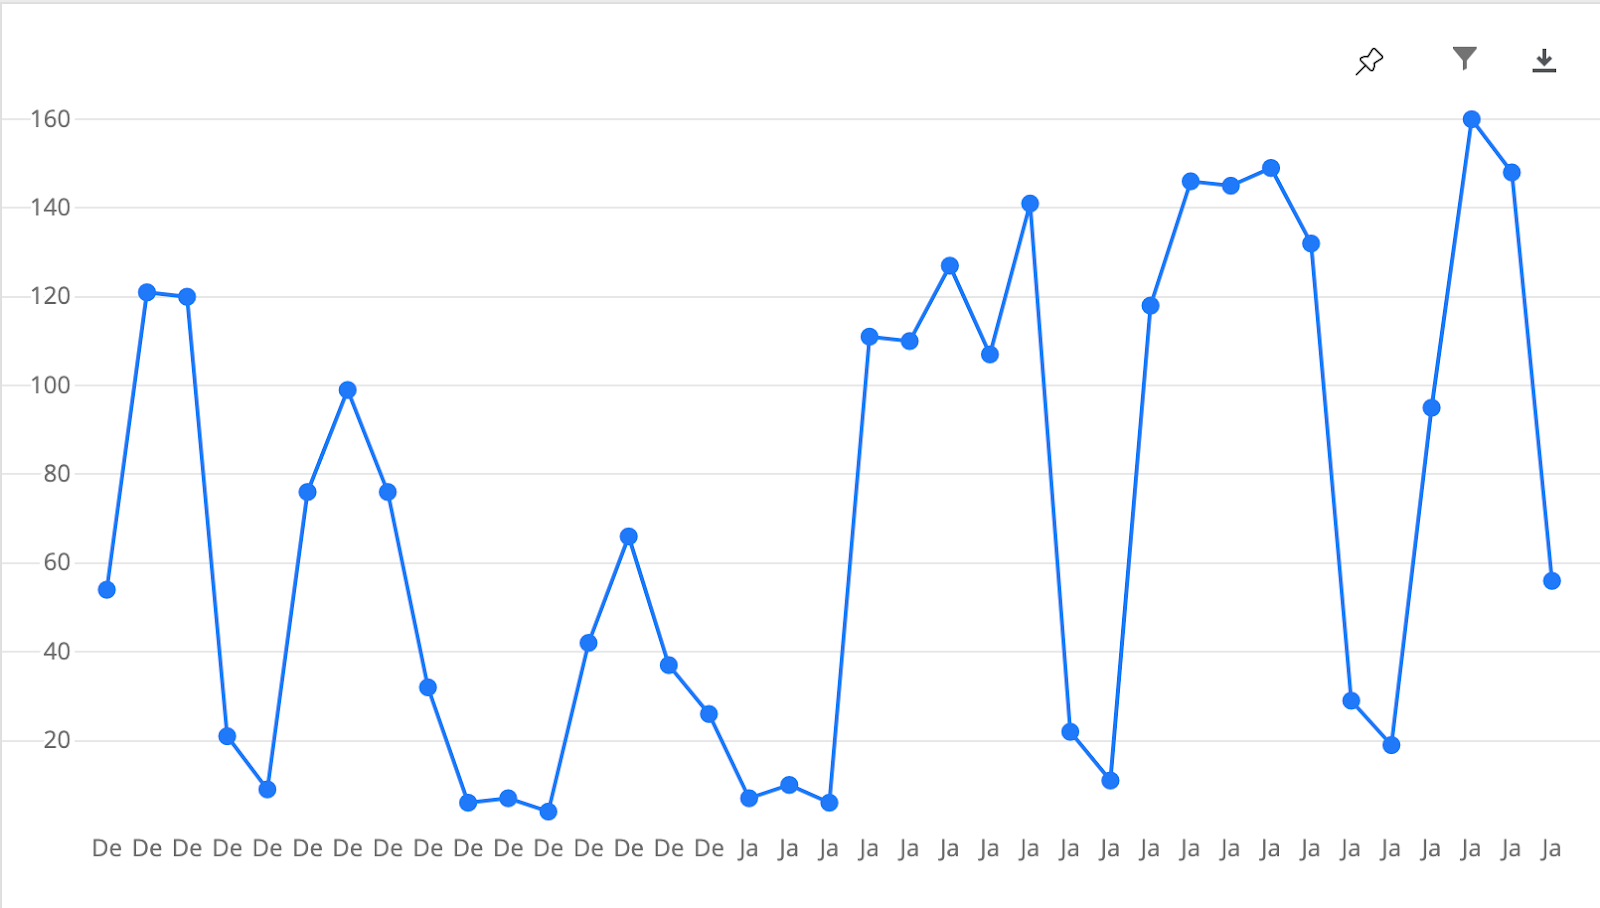
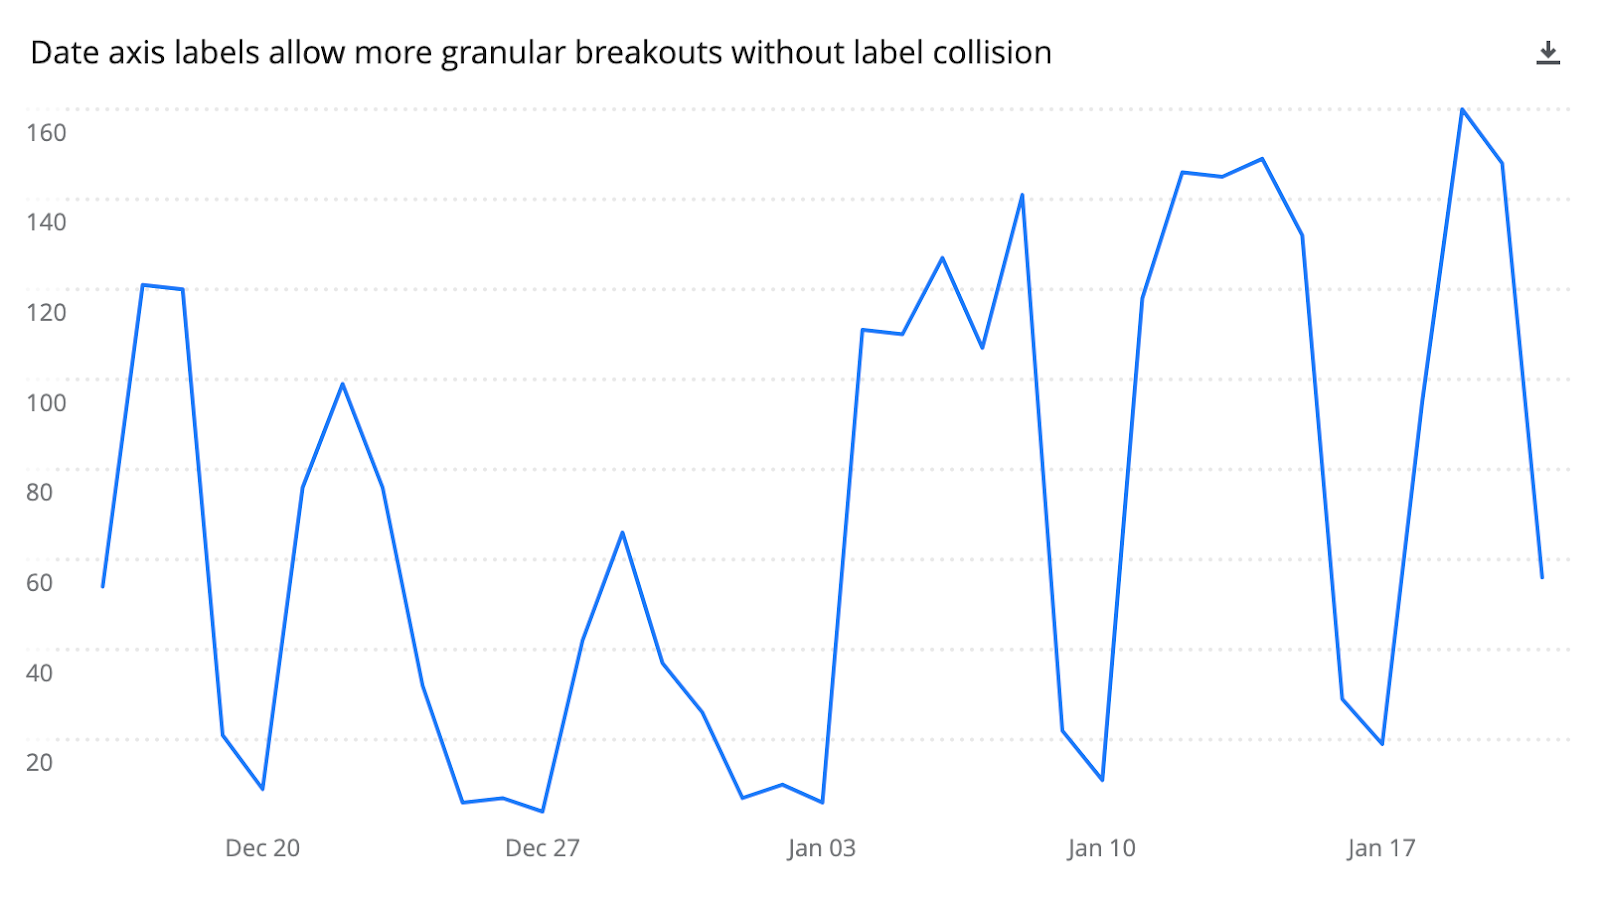
We’ve made improvements to date axis labels that allow more granular grouping of dates. We’ve also added smart label collision detection, which prevents charts with many labels from becoming cut off. These labels scale according to the data domain and the size of the chart.
Before
 After
After
Bar chart updates
These changes apply to simple charts that are in either the horizontal or vertical bar chart orientation.
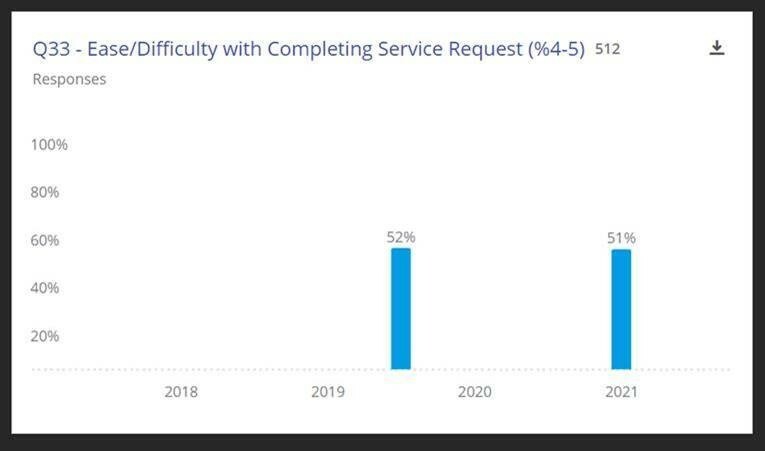
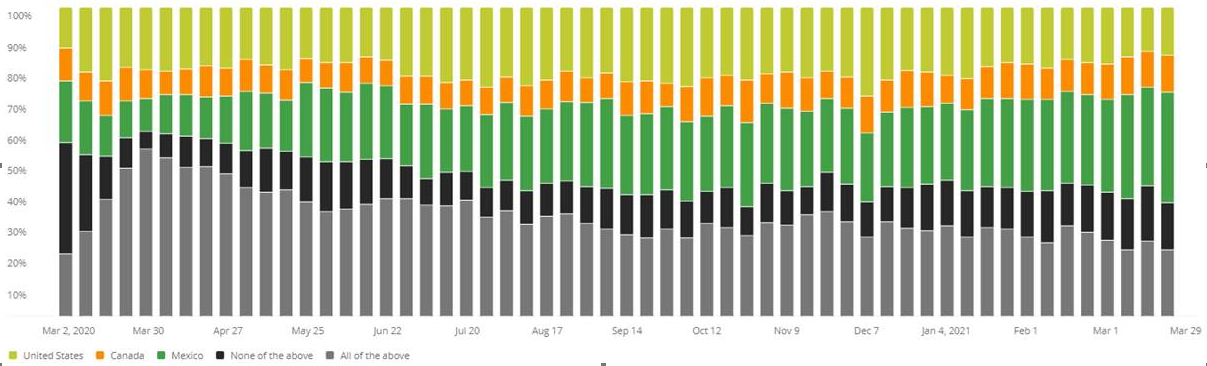
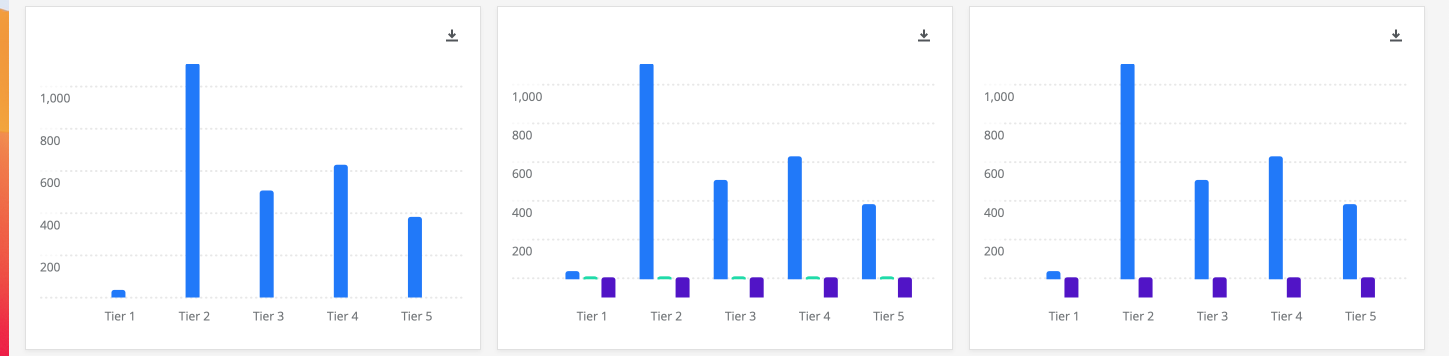
Bars are now a consistent maximum width across all chart sizes independent of the chart width or the number of variables in the breakout. This ensures visual consistency across the dashboard canvas for both small and large bar charts, as well as an updated, more modern visual design.
Before
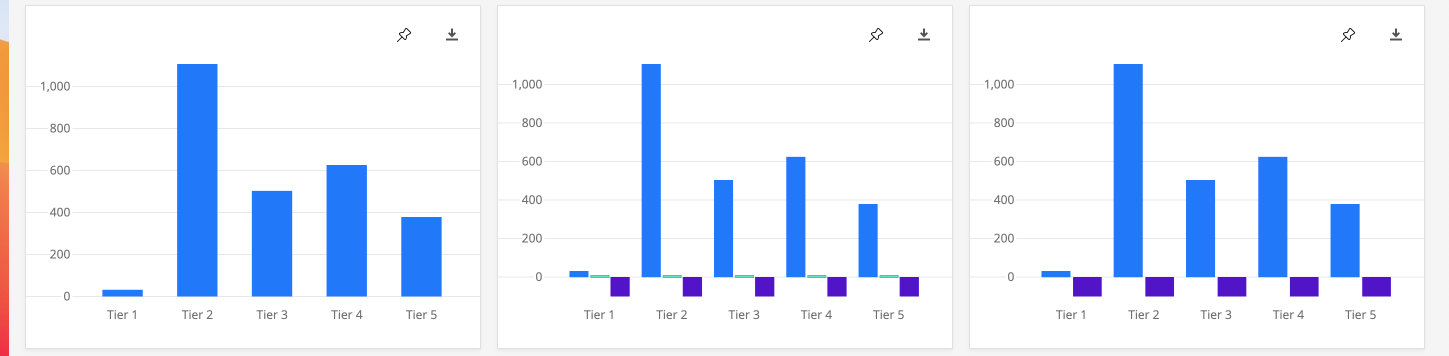 After
After
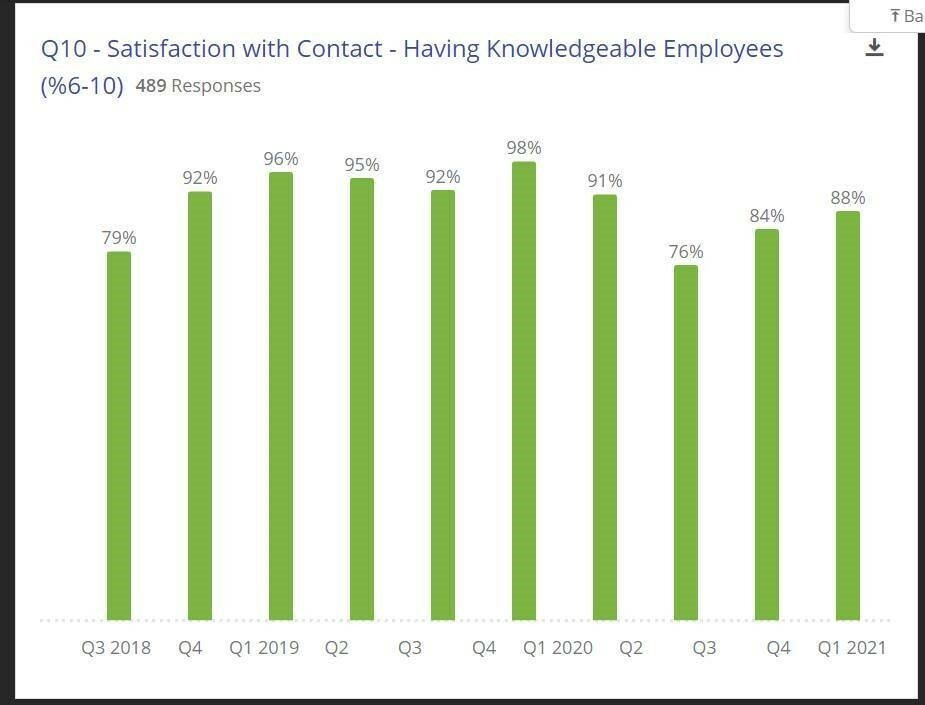
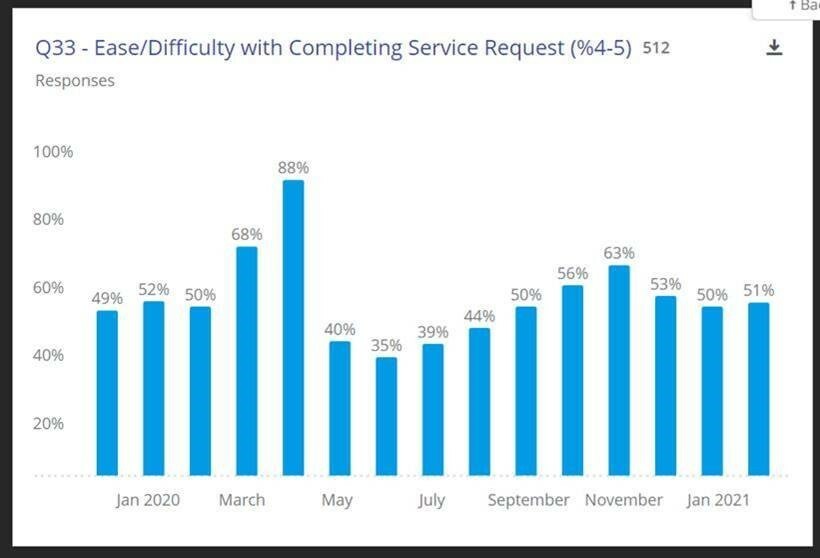
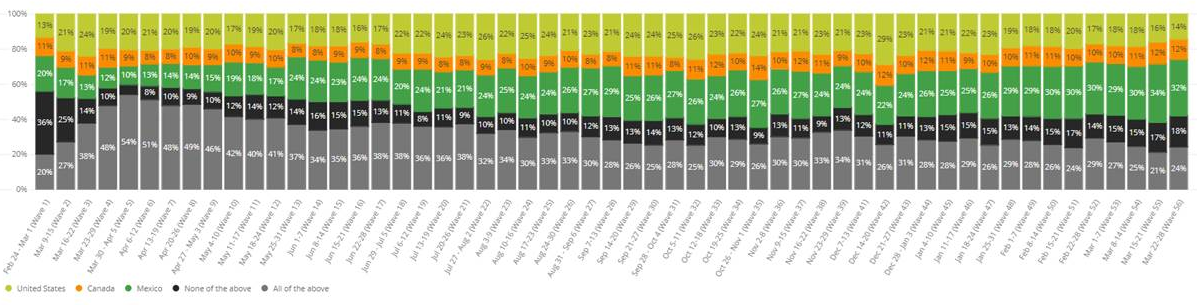
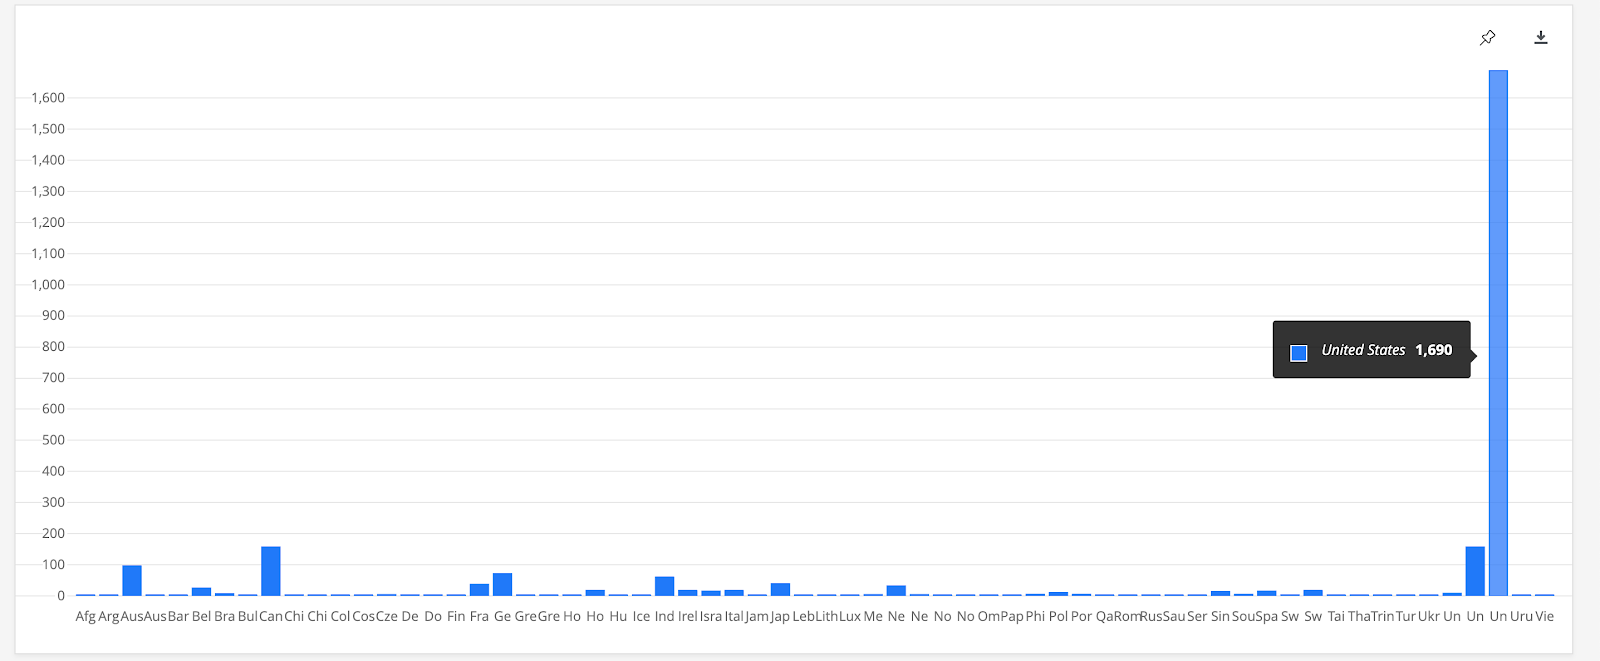
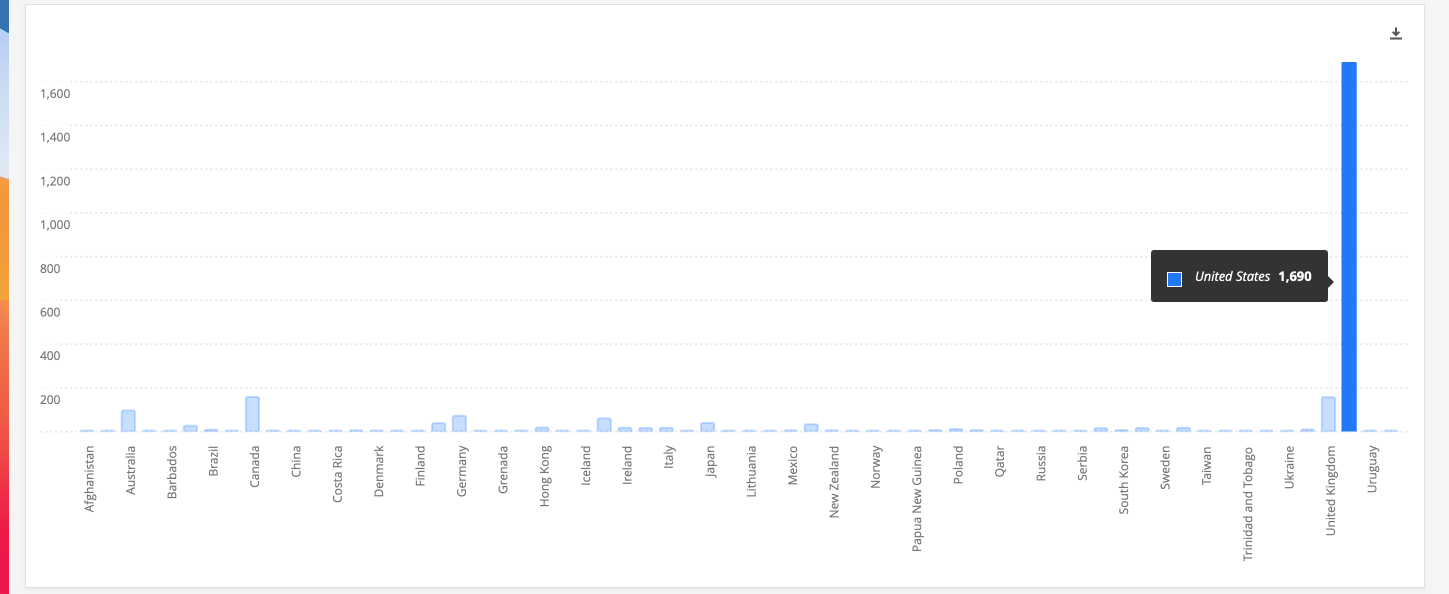
 Axis labels now have smart collision detection and rendering for data dense charts, meaning labels will adjust so they don’t become unreadable; all labels can be accessed by hovering over the chart.
Before
 After
After
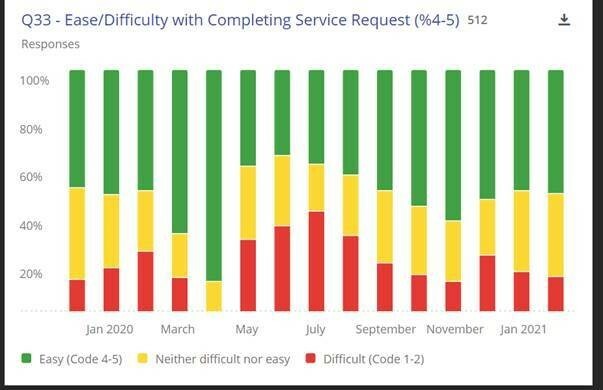
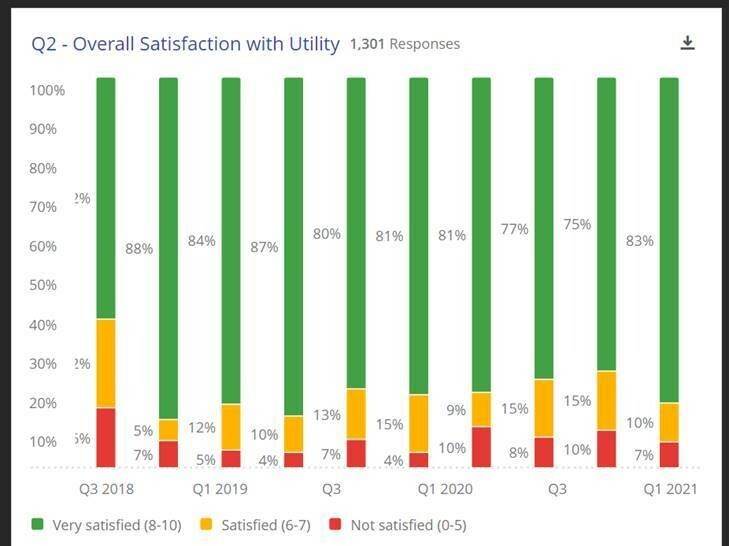
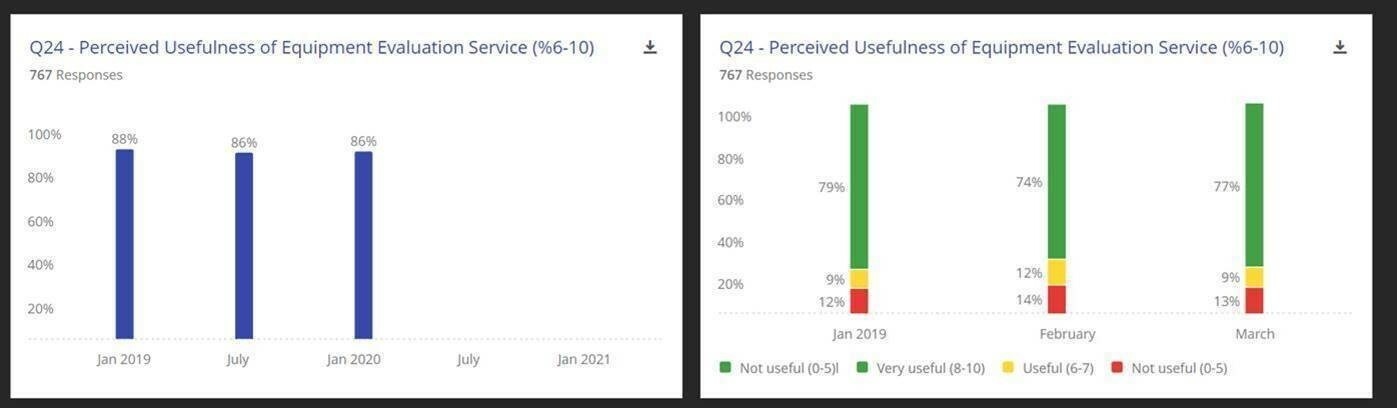
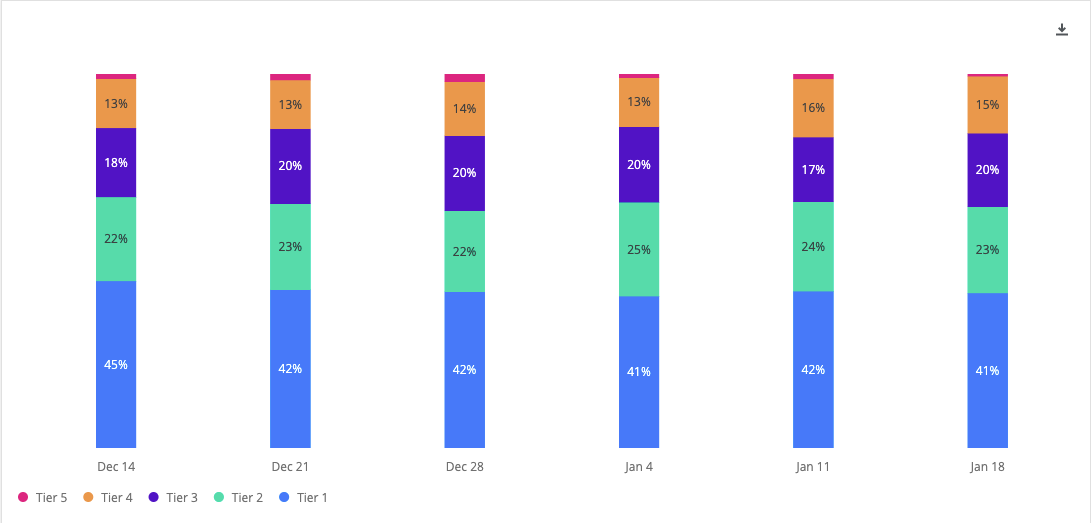
 Stacked bar charts that display data labels now render labels outside the bar in order to have an accessible color contrast ratio. This applies to both vertical and horizontal layouts.
BEFORE
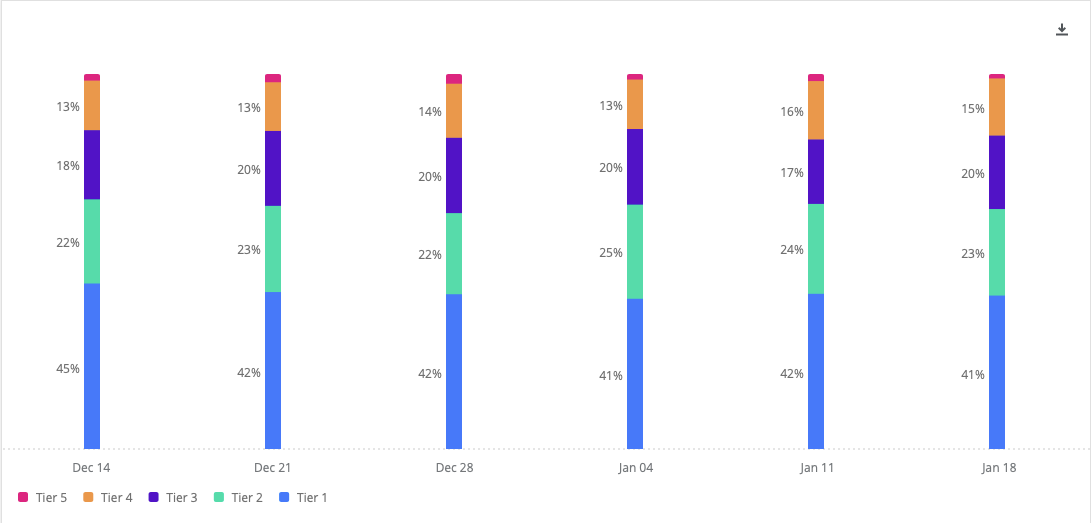
 AFTER
AFTER


") Looking forward to see them on my side and wonder how they will impact small size widgets
Looking forward to see them on my side and wonder how they will impact small size widgets