"Breakdown bar" view in Reports and percentages: what to do when the sum is 101%? | XM Community
Solved

"Breakdown bar" view in Reports and percentages: what to do when the sum is 101%?


I'm sure you all had this - You add a breakdown bar report with percentages, and when the underlying values are 1 and 7 you end up getting 13% and 88%...

This means, when you add the displayed percentages, you get 101%!

!

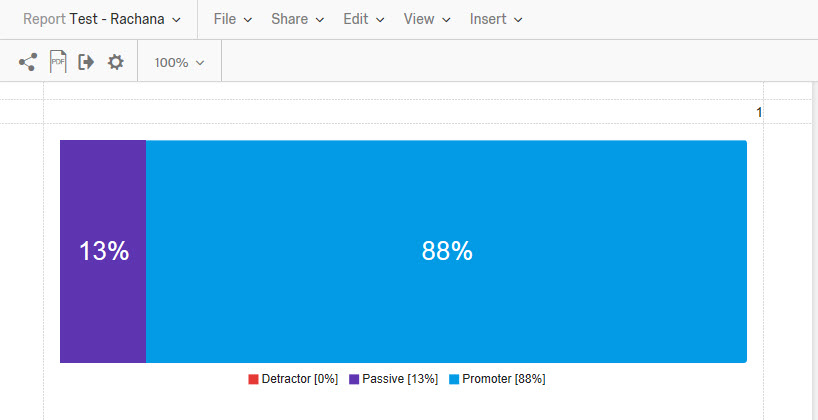
How do you deal with these?
icon

Best answer by BruceK 15 August 2018, 19:29

View original

13 replies

In the UK many bars (well, pubs) have good pies too 😉
Userlevel 3
Badge +11
Well, I've probably spent more time in bars than I have eating pie.
@BruceK thanks - Pies beat bars, then (also in real life - I prefer having a pie 😀 )
Userlevel 3
Badge +11
I second the suggestion for a pie chart - your readers will know that a pie chart shows percentages of the whole and sum to 100%, and will often realize on their own there is rounding. When you see a stacked bar chart, you aren't going to necessarily know it is supposed to sum to 100%
@Shawn_Hochstetler_Walker, the pie chart is a good idea 😀

The Qualtrics Support team have also taken this to Engineering as a change request. Let's see how fast it comes!
Userlevel 5
Badge +19
@alitokmen - I do understand your query. I did face this with few of my clients and the best possible options to tackle them are as follows:

1. As there is no option to change decimal points, you can just add a note "[Data is currently rounded up]" and along with this widget add an simple table widget below the breakdown bar.

2. It would be better to change the view to Pie Chart where you have options to change the decimal places and this would also look visually nice in the reports.
@bstrahin - Explaining is faced with stiff resistance I'm afraid :neutral:

@LaurenK - I've also raised it with the Qualtrics support team now.

If anyone has other hints, I'm taking!
Userlevel 7
Badge +13
Hey @alitokmen! For the most immediate assistance, please reach out to our Support team!
Userlevel 7
Badge +38
@alitokmen if this display is the most appropriate, but you are worried about confusing your readers, you could always add a textbox/footer that reads something like - due to rounding percentages may not add up to 100%.

This was common practice when I worked at a full service market research firm.
I then chose the only bad one :neutral:

@Anyone from Qualtrics, any advice here?
Userlevel 7
Badge +33
For Breakdown bar there is no option to give decimal points, but i can see for normal chart.
... I wish I could do that :neutral: Unfortunately I couldn't figure out how to do this in the Report view.

But maybe I'm blind? Do you see it?
Userlevel 7
Badge +33
Hi @alitokmen , Ideally it should add to 100%, Here in your case data may be correct and its adding to 101% or sometimes 99% is due to rounding off. Can you try adding decimal places (this can solve your problem) while +- 1% if due to rounding off doesn't affect.

Leave a Reply