Hello,
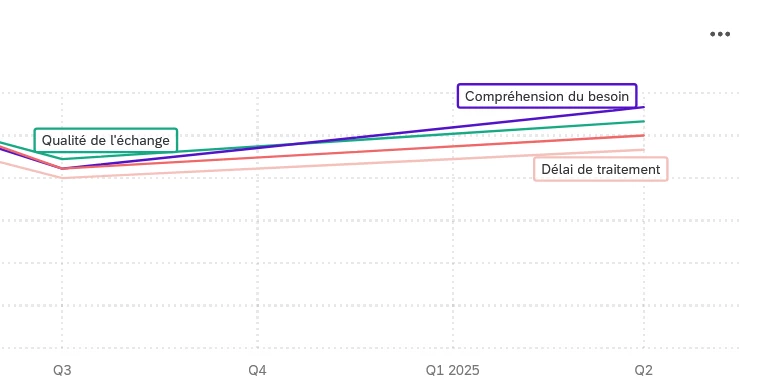
I would like to hide Q4 and Q1 2025 in the following graph, as they do not contain any data.
I used the response threshold, but it only caused the graph to go through those quarters.
Thank you in advance for your help.

 +1
+1Hello,
I would like to hide Q4 and Q1 2025 in the following graph, as they do not contain any data.
I used the response threshold, but it only caused the graph to go through those quarters.
Thank you in advance for your help.
Already have an account? Login

Welcome! To join the Qualtrics Experience Community, log in with your existing Qualtrics credentials below.
Confirm your username, share a bit about yourself, then you're ready to explore and connect .
Free trial account? No problem. Log in with your trial credentials to join. No free trial account? No problem! Register here
Already a member? Hi and welcome back! We're glad you're here 🙂
You will see the Qualtrics login page briefly before being taken to the Experience Community.
No account yet? Create an account
Welcome! To join the Qualtrics Experience Community, log in with your existing Qualtrics credentials below.
Confirm your username, share a bit about yourself, then you're ready to explore and connect .
Free trial account? No problem. Log in with your trial credentials to join. No free trial account? No problem! Register here
Already a member? Hi and welcome back! We're glad you're here 🙂
You will see the Qualtrics login page briefly before being taken to the Experience Community.
Enter your E-mail address. We'll send you an e-mail with instructions to reset your password.