Hello Everyone,
I am looking for advice on a CX Table widget that i need to display the following:
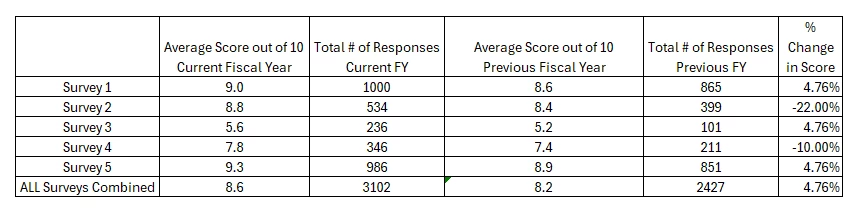
- I have 5 total surveys but i am trying to show how they all contribute to the overall average 0-10 score. For instance a survey with 1,000 responses will drive the score higher or lower depending on its average score compared to a survey with 100.
- The table needs to show our average score between FY as well as how many responses we received
- Bonus if it could show the contribution % to the overall score by each survey type
- The table needs to show our average score between FY as well as how many responses we received
- In the dashboard data, i have each of the surveys mapped to their own individual Number Set variable as well as an overall one that has the combined scores.
Attempts so far:
Multi Source Table: I was able to look at the averages for all 5 surveys plus the overall score, but i could not figure out how to show a Count columns in between the averages to display how many responses we received in each of those years
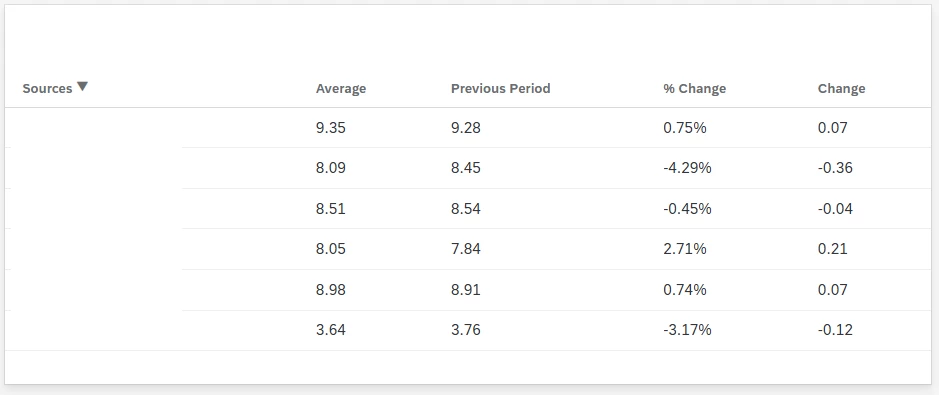
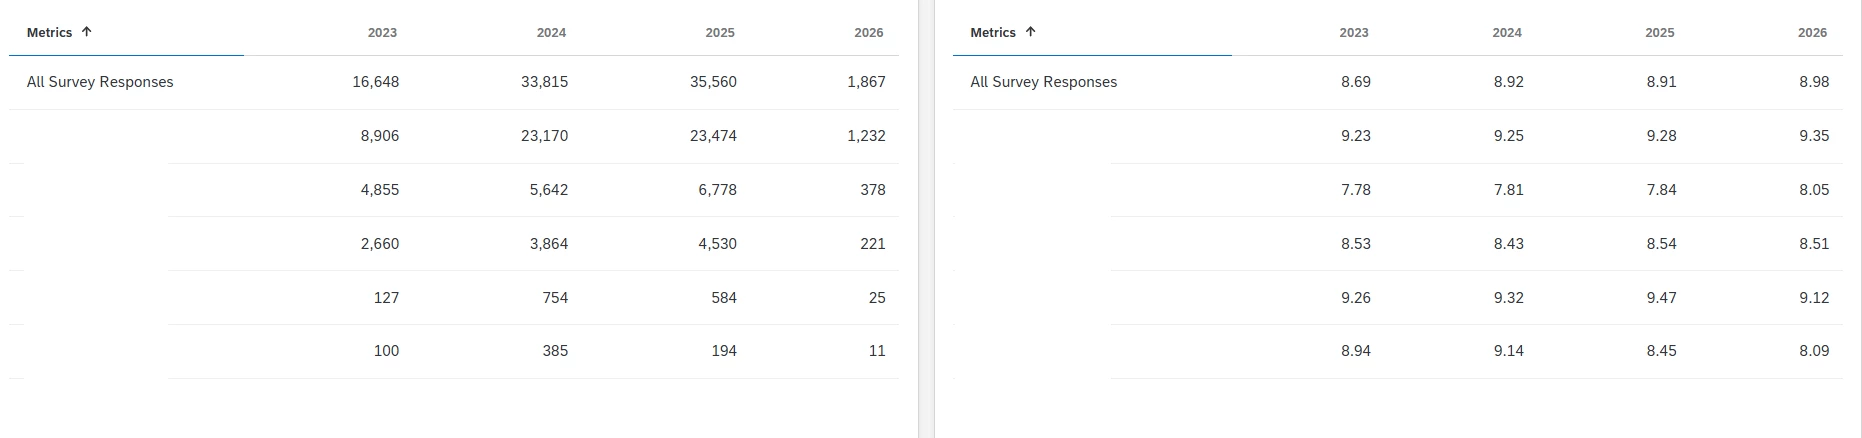
Table Widget:
Creating 2 separate table widgets i was able to display the averages and response totals separately, but I was unable to line it up as intended on 1 table.
Thanks for any advice!