How can I add a trend line to a monthly distribution chart? I attach the chart below, to which I would like to add an NPS trend line. The idea is to mix the first graph with the second one, which I will add below
  How can I do it? Is this possible? Thanks!
Trend chart and Simple char, all in one
Best answer by NiC
hi Alea
Yes it is very much possible
Here i assume your Data Series is the recorded date / end date / start date
Now if you have the NPS data as X - Axis data, then we won't be able to do this with this in X-axis then we don't have option to add any more metrics.
So if you have something other than Metrics in data series remove it. and have Date in X-Axis
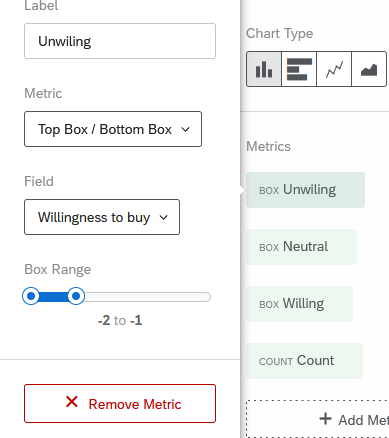
We need to have multiple metrics 1 for detractor , 1 for promoters, 1 for passive (For these 3 Top/bottom box metrics would be ideal) and 1 for NPS score.
After adding all these your metrics your simple chart should look something like this(i didn't have an NPS question)
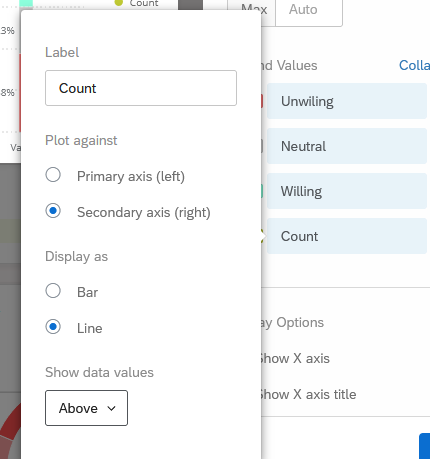
Now scroll down on the same settings column of this widget and you should see the section named
Legend Values . Below this section you will see all the metrics added above listed here, so you can go ahead and click on the NPS metric it where in you will be greeted by a window as seen below You should ideally select the secondary axis for NPS value as it is measured on a different scale as compared to other values and also mark it as a line.
This will give you something like this
Sign up
Already have an account? Login

Welcome! To join the Qualtrics Experience Community, log in with your existing Qualtrics credentials below.
Confirm your username, share a bit about yourself, Once your account has been approved by our admins then you're ready to explore and connect .
Free trial account? No problem. Log in with your trial credentials to join.
No free trial account? No problem! Register here
Already a member? Hi and welcome back! We're glad you're here 🙂
You will see the Qualtrics login page briefly before being taken to the Experience Community
Login with Qualtrics

Welcome! To join the Qualtrics Experience Community, log in with your existing Qualtrics credentials below.
Confirm your username, share a bit about yourself, Once your account has been approved by our admins then you're ready to explore and connect .
Free trial account? No problem. Log in with your trial credentials to join. No free trial account? No problem! Register here
Already a member? Hi and welcome back! We're glad you're here 🙂
You will see the Qualtrics login page briefly before being taken to the Experience Community
Login to the Community

Welcome! To join the Qualtrics Experience Community, log in with your existing Qualtrics credentials below.
Confirm your username, share a bit about yourself, Once your account has been approved by our admins then you're ready to explore and connect .
Free trial account? No problem. Log in with your trial credentials to join.
No free trial account? No problem! Register here
Already a member? Hi and welcome back! We're glad you're here 🙂
You will see the Qualtrics login page briefly before being taken to the Experience Community
Login with Qualtrics

Welcome! To join the Qualtrics Experience Community, log in with your existing Qualtrics credentials below.
Confirm your username, share a bit about yourself, Once your account has been approved by our admins then you're ready to explore and connect .
Free trial account? No problem. Log in with your trial credentials to join. No free trial account? No problem! Register here
Already a member? Hi and welcome back! We're glad you're here 🙂
You will see the Qualtrics login page briefly before being taken to the Experience Community
Enter your E-mail address. We'll send you an e-mail with instructions to reset your password.


