How to view responses from multiple 5-point Likert matrix questions into a single widget | Experience Community
Skip to main content
Solved

How to view responses from multiple 5-point Likert matrix questions into a single widget

  • February 18, 2026
  • 6 replies
  • 38 views

Forum|alt.badge.img+3

Hi all

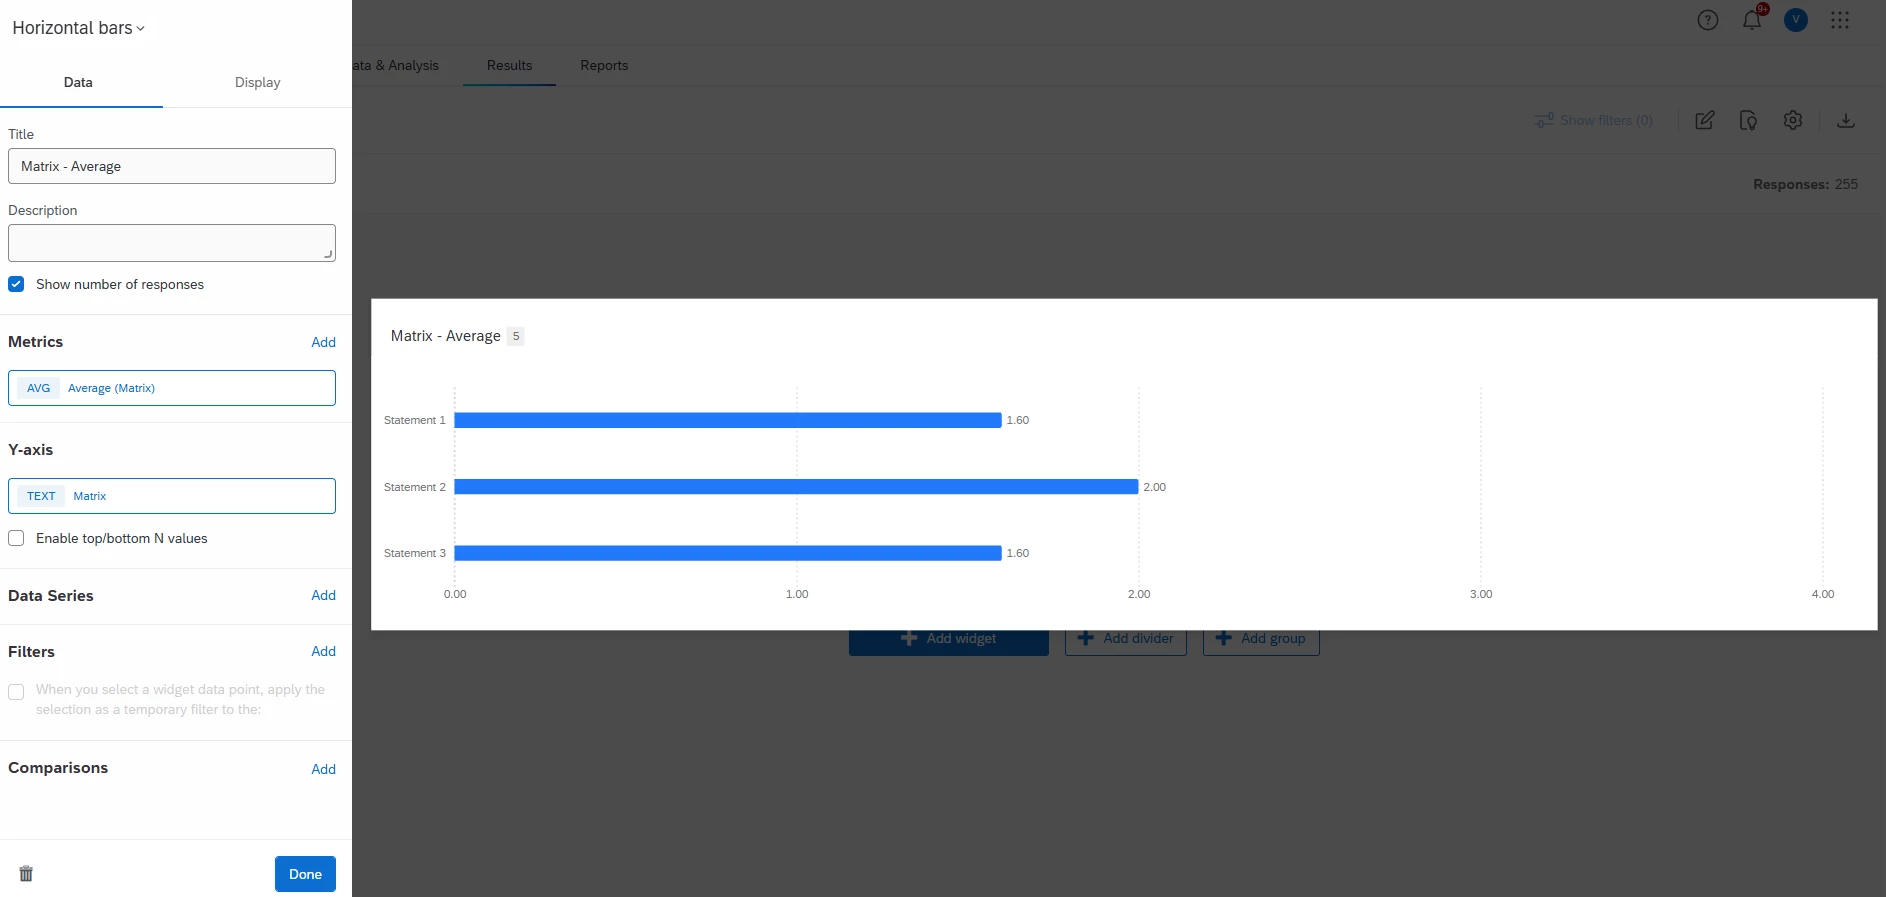
  1. I want to create a horizontal bar widget that tallies the responses of 10 survey items contained a matrix table that used a 5-Point Likert scale.
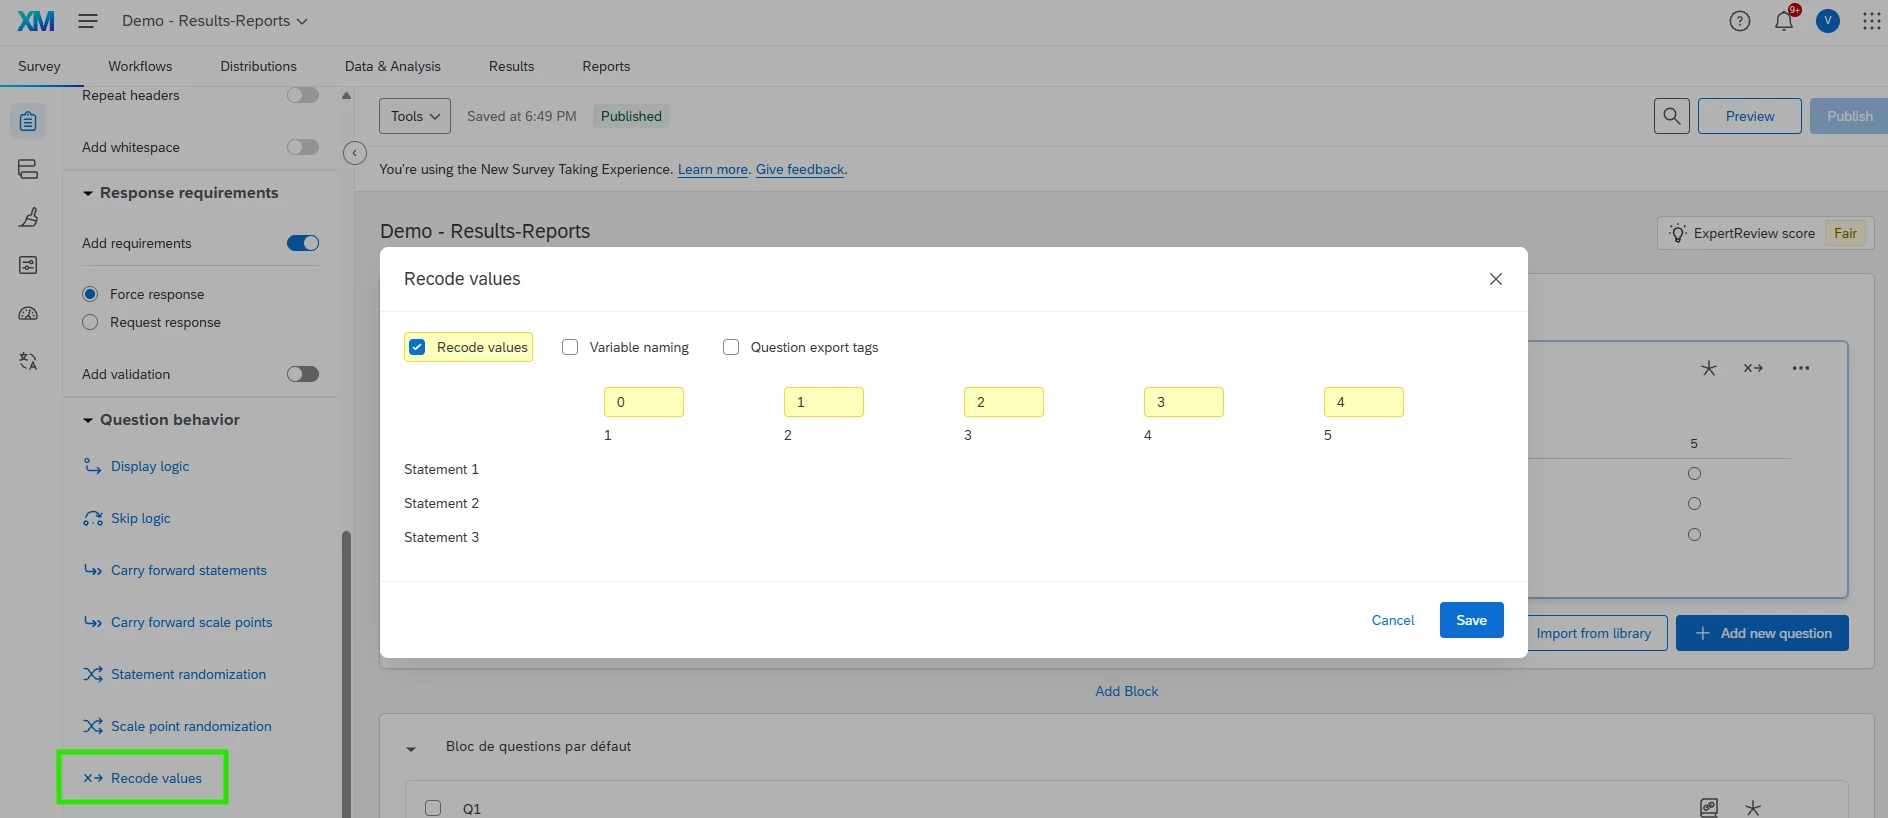
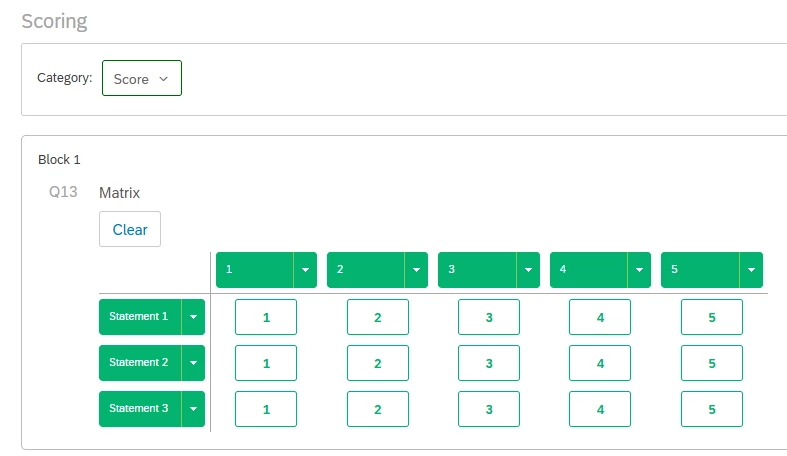
  1. I also wish to assign numeric values (0-4) to each Likert response so that individual and average respondent scores fcan be calculated
  2. Calculate the average scores for each of the 10 items in the matrix table

Can anyone assist please?
Regards

Mark

Best answer by vgayraud

Hi,

Assign recode values to your matrix scale in your survey:

Then build an horizontal bar widget in your results with the average metric on your matrix with a Y-axis breakdown on the matrix:


6 replies

Forum|alt.badge.img+3
  • Level 2 ●●
  • February 18, 2026

Hi ​@Mark d. , Here are the steps for mapping and displaying multiple statements in a matrix question in single widget.

Similarly, we can also map multiple matrix questions to a single measure group and recode the scale points to align with each other. Then use it for dashboard reporting.


Forum|alt.badge.img+3
  • Author
  • Level 2 ●●
  • February 19, 2026

Thanks Anushree


I did go through that support page, but I cannot locate the Add Field Group button.


Here is a screenshot of my Data and Analysis window:


When I go into the Field Editor there is only the ability to add a field, and again there is no Add Field Group button:


I ended up adding a few Source and Destination fields and setting the type of data. However, still no closer to combining multiple matrix items in the same widget.

Regards

Mark


Forum|alt.badge.img+3
  • Level 2 ●●
  • February 19, 2026

@Mark d. , This data mapping is available in Qualtrics CX dashboard and not in survey results dashboard. In data mapping tab of CX dashboards, you will see an option to add field group where you can select measure group and use it in CX dashboard widgets.

It’s not possible to combine multiple matrix questions into 1 field group in results dashboard. 


vgayraud
QPN Level 7 ●●●●●●●
Forum|alt.badge.img+61
  • QPN Level 7 ●●●●●●●
  • Answer
  • February 19, 2026

Hi,

Assign recode values to your matrix scale in your survey:

Then build an horizontal bar widget in your results with the average metric on your matrix with a Y-axis breakdown on the matrix:


Forum|alt.badge.img+3
  • Author
  • Level 2 ●●
  • February 24, 2026

Thanks ​@vgayraud 

This is useful for showing average responses for each statement in the matrix table

The matrix consists of 5 statements each marked 1-5 according to Likert response. Each respondent is thus given a score from 5-25 for this matrix question.

How can I now create a widget that displays the average score out of 25 for the respondents?


vgayraud
QPN Level 7 ●●●●●●●
Forum|alt.badge.img+61
  • QPN Level 7 ●●●●●●●
  • February 24, 2026

Hi,

Use a scoring category and display the average on the score in your widget.