

Hello,
I am trying to create a survey that will collect information about participants food consumption and driving behaviours. Their values will be used to calculate their carbon footprint and the percentage value of each category (i.e., food and driving). Then I would like to present these percentages to the participants on the next page in pi chart form.
I am very new to this and I have no idea what I am doing.
I started by setting the embedded data values:
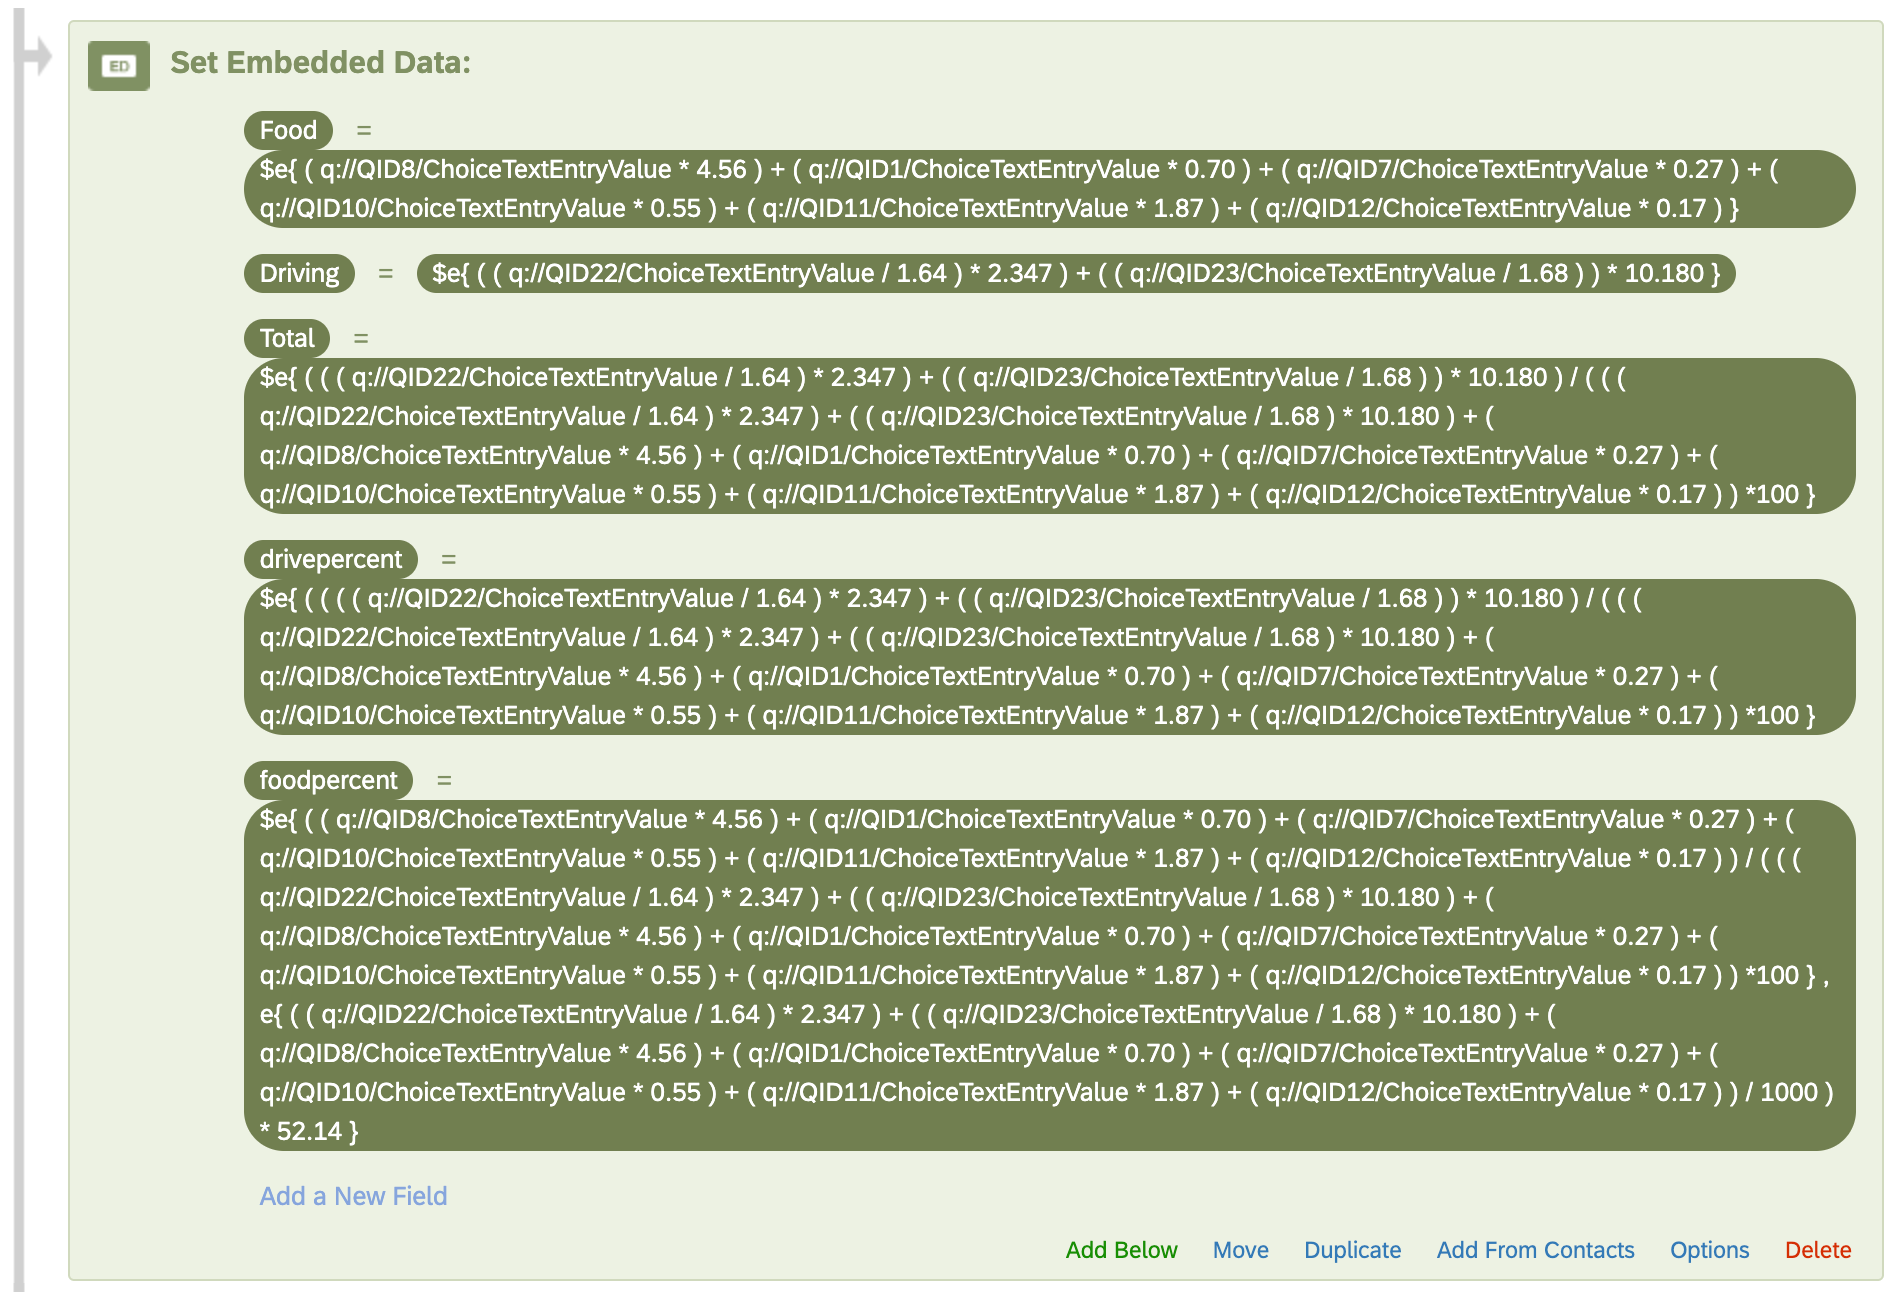
This seems to work, as I am able to see the calculated percentages in text from in the preview.
However, I want these values to be visualized in a pi chart. I have added code to the javascript of my survey but it seems like no matter what I do the script cant retrieve the values.
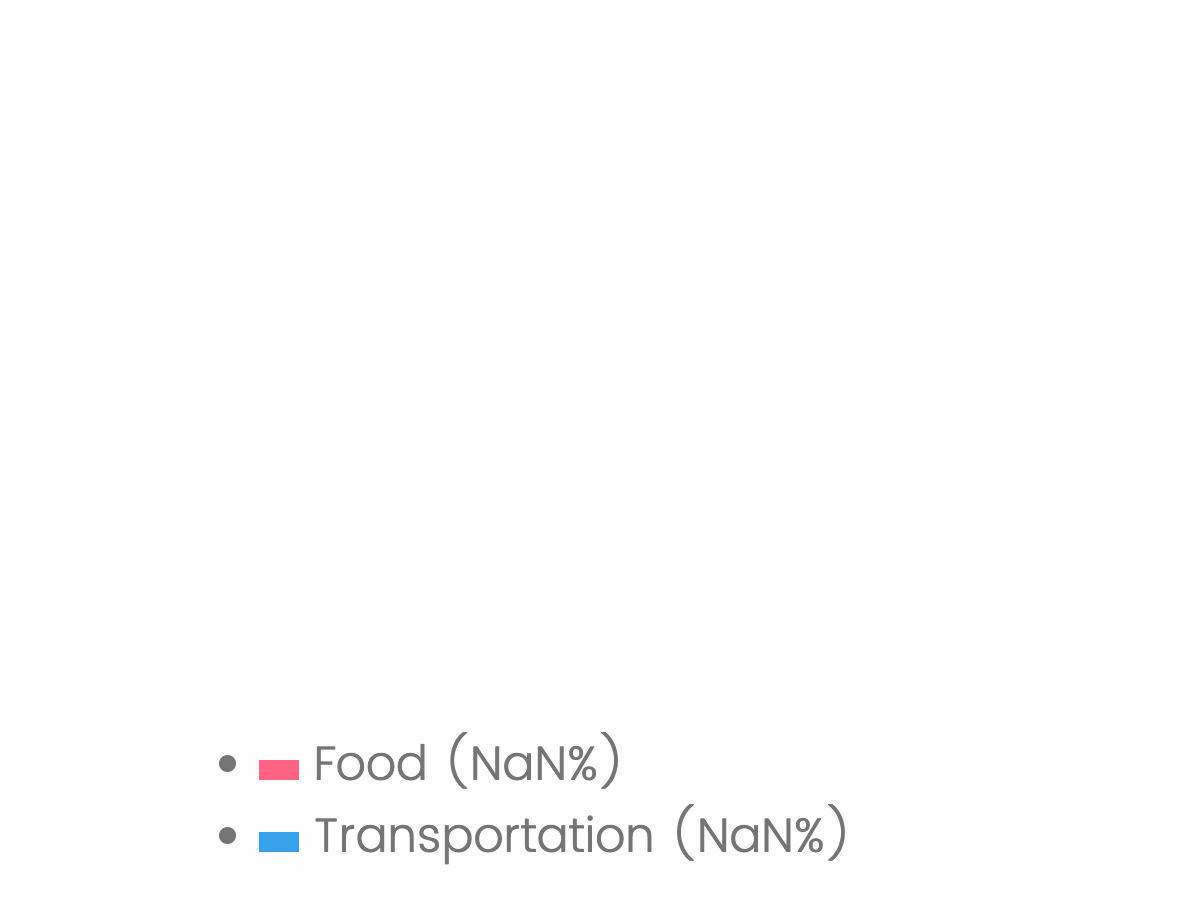
This is the code that I am using in the javascript and I am using “ <div id="pieChartContainer"></div>” in the HTML
Qualtrics.SurveyEngine.addOnload(function() {

    // Retrieve values from embedded data

    var value1 = parseInt(Qualtrics.SurveyEngine.getEmbeddedData('foodpercent'), 10) || 0; // Default to 0 if undefined or not a number

    var value2 = parseInt(Qualtrics.SurveyEngine.getEmbeddedData('drivepercent'), 10) || 0;


    // Log the values to check if they are correctly retrieved and parsed

    console.log('Food Percent:', value1);

    console.log('Drive Percent:', value2);
    // Define pie chart data using embedded data

    var pieChartData = [

        { label: "Food", value: value1 },

        { label: "Transportation", value: value2 }

    ];
    // Create a canvas element to draw the pie chart

    var canvas = document.createElement('canvas');

    canvas.width = 400;

    canvas.height = 400;

    var ctx = canvas.getContext('2d');
    // Calculate total value of data for percentage calculation

    var total = pieChartData.reduce(function(acc, data) {

        return acc + data.value;

    }, 0);
    // Define colors for each slice of the pie chart

    var colors = ['#FF6384', '#36A2EB']; // Adjusted for two values
    // Draw the pie chart

    var startAngle = 0;

    pieChartData.forEach(function(data, index) {

        var sliceAngle = (2 * Math.PI * data.value) / total;

        ctx.fillStyle = colors[index];

        ctx.beginPath();

        ctx.moveTo(canvas.width / 2, canvas.height / 2);

        ctx.arc(canvas.width / 2, canvas.height / 2, canvas.width / 2, startAngle, startAngle + sliceAngle);

        ctx.closePath();

        ctx.fill();

        startAngle += sliceAngle;

    });
    // Append canvas to the pieChartContainer div

    document.getElementById('pieChartContainer').appendChild(canvas);
    // Display legend

    var legend = document.createElement('ul');

    pieChartData.forEach(function(data, index) {

        var listItem = document.createElement('li');

        listItem.innerHTML = '<span style="display:inline-block;width:20px;height:10px;background-color:' + colors[index] + '"></span> ' + data.label + ' (' + ((data.value / total) * 100).toFixed(2) + '%)';

        legend.appendChild(listItem);

    });
    // Append legend to the pieChartContainer div

    document.getElementById('pieChartContainer').appendChild(legend);

});

