Display embedded data in result tab | XM Community
Skip to main content
Solved

Display embedded data in result tab


Forum|alt.badge.img+2

Dear Forum,


the current situation: 
I have some JavaScript code running, that embeds a Chatbot into the survey.
This code also fetches the number of words the user has put in, as well as the number of words that the bot responded with and displays these numbers dynamically.

As these are important variables for my analysis later on, I do not only need these numbers to be displayed during the survey, but I need these numbers to be added to the “answers” given to the question, to perform calculations and regressions afterwards. 

Good news is, I have created embedded variables in the survey flow, declaring these as numbers, and I am able to update these embedded variables via my JS code. I have also access to these numbers in the Data & Analysis tab, but not via the Results tab.


The current problem:

Is there a way, to get this embedded data into the results tab too, so I do not run the risk of having to match the numbers to the respective response by hand? 

I have attached a stripped down version of my code below. 


Any help is appreciated.

Qualtrics.SurveyEngine.addOnload(function() {
function updateEmbeddedData() {
// Update embedded data fields with the current counter values
Qualtrics.SurveyEngine.setEmbeddedData('Ed_UserWordCount', userWordCount;
Qualtrics.SurveyEngine.setEmbeddedData('Ed_ChatbotWordCount', chatbotWordCount;
Qualtrics.SurveyEngine.setEmbeddedData('Ed_MessageCount', totalMessageCount;
}

updateEmbeddedData(); // Update embedded data fields
});


Best answer by JonesE

Hi @Kobe H!

Based on what you described, you should be able to view these data in your Results tab alongside the respective responses. Make sure you’ve declared your embedded data elements in your survey flow, and as @Sowrabh1993 mentioned above, be sure those embedded data elements are properly categorized (otherwise, you may not see the embedded variables available for certain widgets in Results).

A Record Grid widget in Results could be helpful for viewing a table of individual responses and relevant embedded and/or survey variable values (each row being an individual response). I also like to toggle on the “show full response when clicked” option in the Record Grid so I can view all associated response data for that particular response. Alternatively, you could format the Results page to display individual widgets for reporting your data and embedded values, then apply filters to the entire page to view individual responses.

Hope this helps!

-Erin

View original

8 replies

SaurabhPujare_Ugam
QPN Level 5 ●●●●●
Forum|alt.badge.img+18

Hey @Kobe H ,

Great to e-meet you.

Must say that your code above is impressive! Regarding your query, have you PUBLISHED the survey before viewing the variable in reports?

Just to be sure, you are referencing to “reports” and “results” tab, right?


Sowrabh1993
QPN Level 5 ●●●●●
Forum|alt.badge.img+15
  • QPN Level 5 ●●●●●
  • 105 replies
  • July 5, 2023

 Hi @Kobe H ,


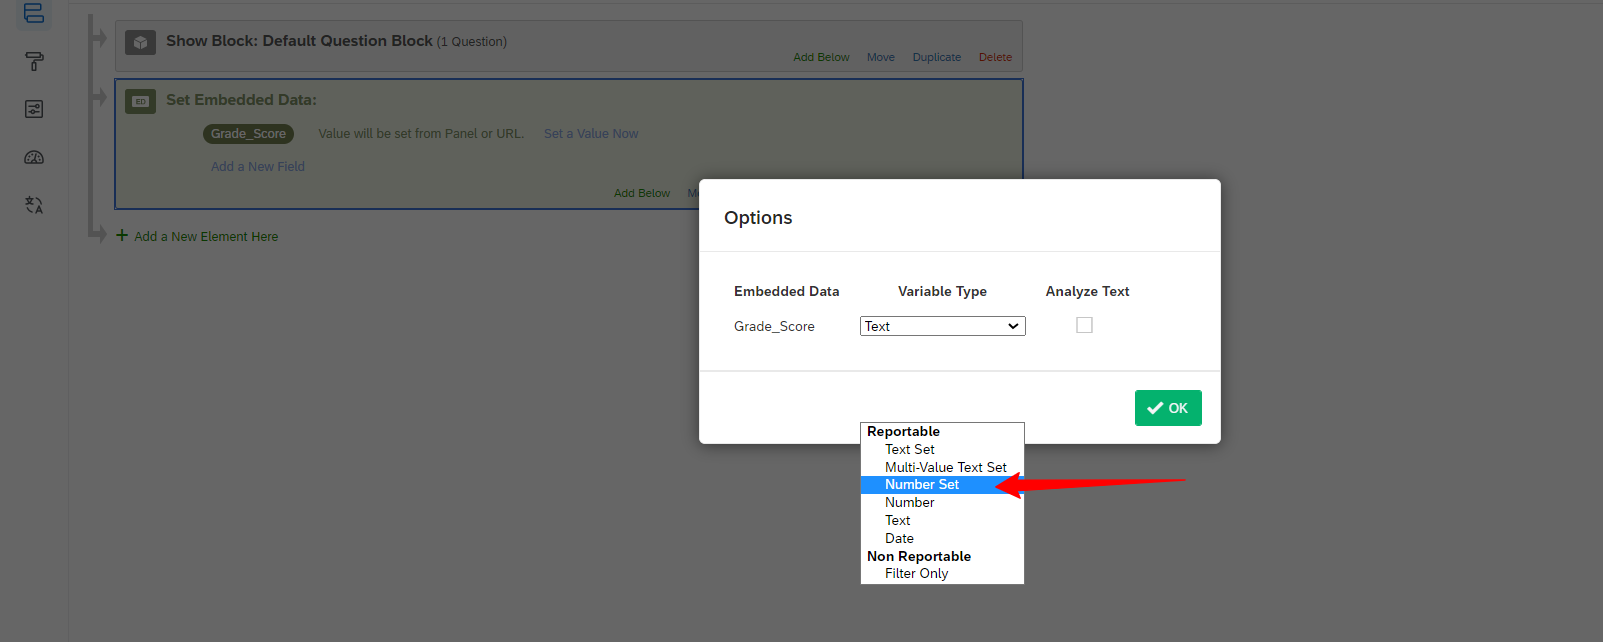
Can you confirm if you have created the embedded data as text set or number set? You should be able to see it if the Embedded data is created as TextSet or NumberSet.

Please keep me posted if this works.


JonesE
Level 4 ●●●●
Forum|alt.badge.img+22
  • Level 4 ●●●●
  • 54 replies
  • Answer
  • July 5, 2023

Hi @Kobe H!

Based on what you described, you should be able to view these data in your Results tab alongside the respective responses. Make sure you’ve declared your embedded data elements in your survey flow, and as @Sowrabh1993 mentioned above, be sure those embedded data elements are properly categorized (otherwise, you may not see the embedded variables available for certain widgets in Results).

A Record Grid widget in Results could be helpful for viewing a table of individual responses and relevant embedded and/or survey variable values (each row being an individual response). I also like to toggle on the “show full response when clicked” option in the Record Grid so I can view all associated response data for that particular response. Alternatively, you could format the Results page to display individual widgets for reporting your data and embedded values, then apply filters to the entire page to view individual responses.

Hope this helps!

-Erin


Forum|alt.badge.img+2
  • Author
  • Level 1 ●
  • 2 replies
  • July 5, 2023

@SaurabhPujare_Ugam Appreciate the feedback! I did publish the survey beforehand, and yes I was referencing the “Results” tab. 

@Sowrabh1993 In a previous version I had these values changed to numbers, which didn’t help but after reading your comment I also adapted the current version and together with the suggestion  from @JonesE regarding the Record Grid and filters, the numbers finally showed up in their separate table. 👏


Thank you all so much for your help, highly highly appreciate it!  :) 


Forum|alt.badge.img+2

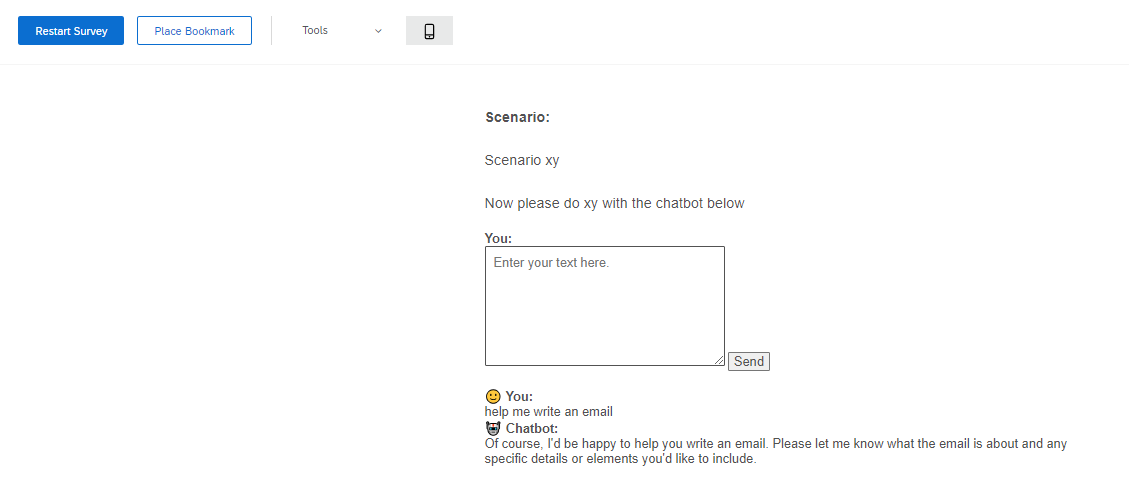
hi @Kobe H  would you be able to share how does the chatbot embedded into the survey looks like? sounds like a cool way to make the survey to be interactive


Forum|alt.badge.img+2
  • Author
  • Level 1 ●
  • 2 replies
  • July 6, 2023

@WilliamWong991 the interface is pretty basic as the focus of my research dictates that but I added a screenshot so you can take a look  :) 

Cheers


Forum|alt.badge.img+2
Kobe H wrote:

@WilliamWong991 the interface is pretty basic as the focus of my research dictates that but I added a screenshot so you can take a look  :) 

Cheers

impressive. didn’t know that’s possible to include a chatbot into the survey. would you consider to add it into other part of the platform such as dashboard / reports?


Forum|alt.badge.img+2

Is there a way to group the embedded data on the results tab? Right now, it sounds like you have to look at the embedded data for each individual response or apply filtering to find the number that met your condition for the embedded data.

Is there a way to just show the number of people that fell into a certain group in your embedded data without having to filter or look at individual responses.