Hi All
In a recent survey I asked respondents to select multiple options.
In the next question I carry forward these selections then ask why they selected them.
Whats the best dashboard widget for this?
Thanks :)

Hi All
In a recent survey I asked respondents to select multiple options.
In the next question I carry forward these selections then ask why they selected them.
Whats the best dashboard widget for this?
Thanks :)
Best answer by parkie_0007
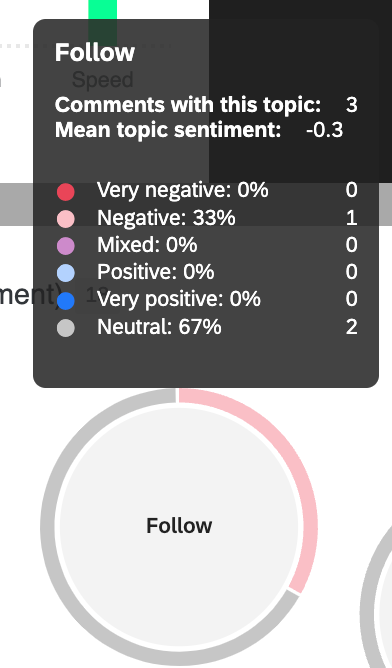
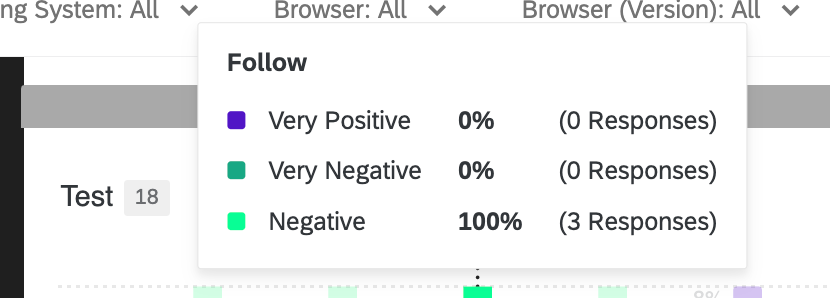
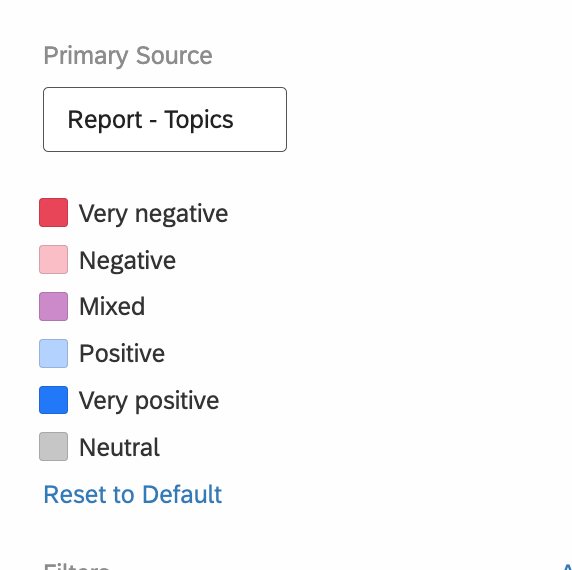
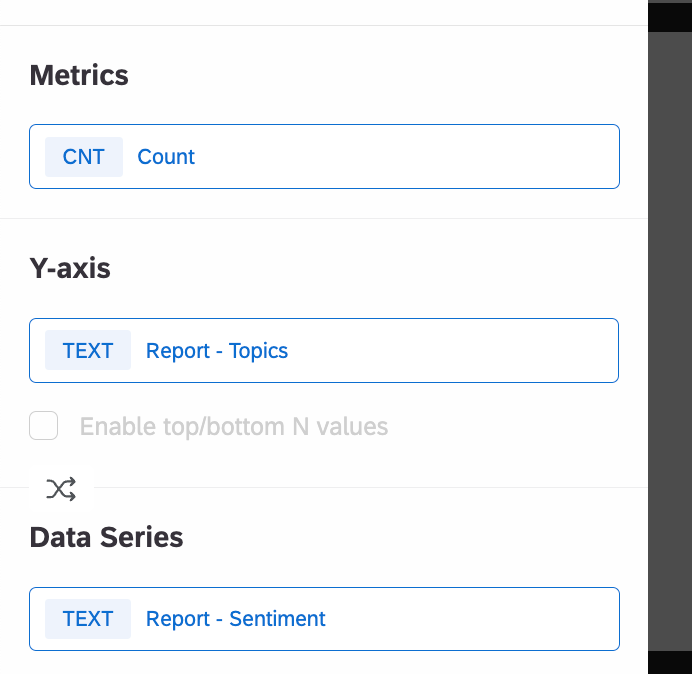
You can also rely on text iq and crate a bar chart displaying the % of mentions for each topic and each option selected
The carry forward question with open text only show up as individual options in Text IQ and not grouped?
Already have an account? Login

Welcome! To join the Qualtrics Experience Community, log in with your existing Qualtrics credentials below.
Confirm your username, share a bit about yourself, then you're ready to explore and connect .
Free trial account? No problem. Log in with your trial credentials to join. No free trial account? No problem! Register here
Already a member? Hi and welcome back! We're glad you're here 🙂
You will see the Qualtrics login page briefly before being taken to the Experience Community.
No account yet? Create an account
Welcome! To join the Qualtrics Experience Community, log in with your existing Qualtrics credentials below.
Confirm your username, share a bit about yourself, then you're ready to explore and connect .
Free trial account? No problem. Log in with your trial credentials to join. No free trial account? No problem! Register here
Already a member? Hi and welcome back! We're glad you're here 🙂
You will see the Qualtrics login page briefly before being taken to the Experience Community.
Enter your E-mail address. We'll send you an e-mail with instructions to reset your password.