I don't think you are using the correct question type then. For the drill down question, the visualisation will always be broken into the categories. Try using the "Enter a date" type and put Content validation as date in a certain format (so you don't get options like 5.2.2019, 2.5.2019. 05.02.19, Feb 5, 2019, etc, which would mean same day in different circumstances)
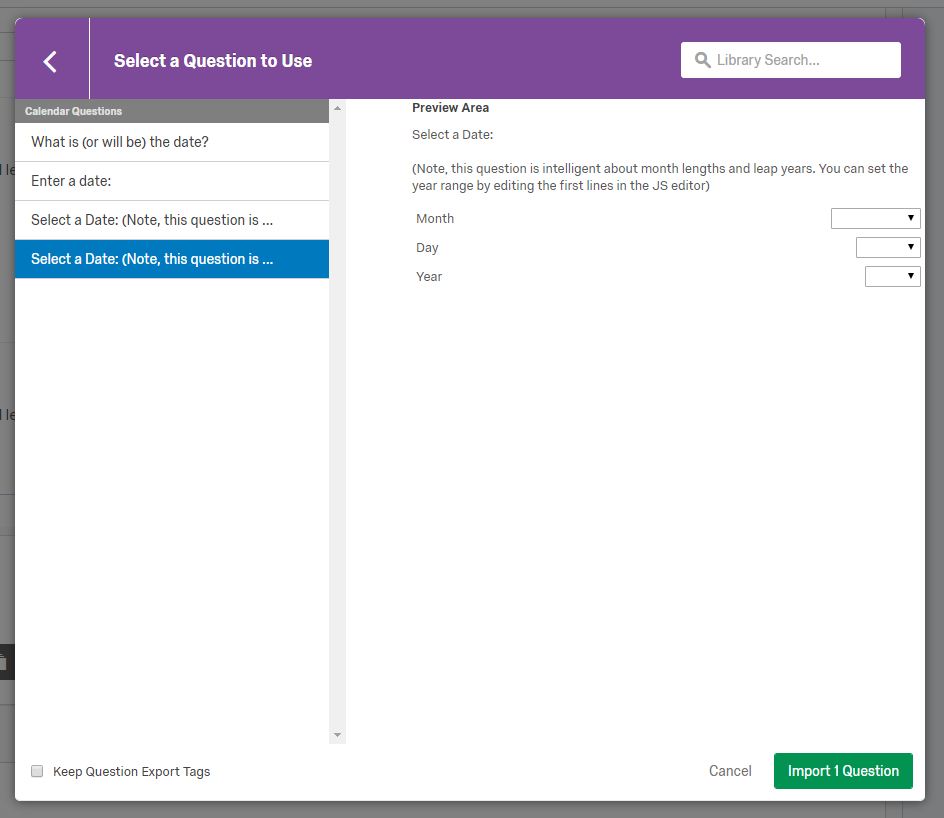
@Michael_S to follow up to @MSlreen you can use the "Enter date:" question from your screen shot. You will want to add validation though. So in the right hand menu for the question, check
* Content Validation
* And then when the new list appears under it, choose date (you can use the drop down to select your format)
Even though it looks like a text entry field it will give you a calendar. It is a nice feature if your dates aren't too far out (the further out the more they will have to click).
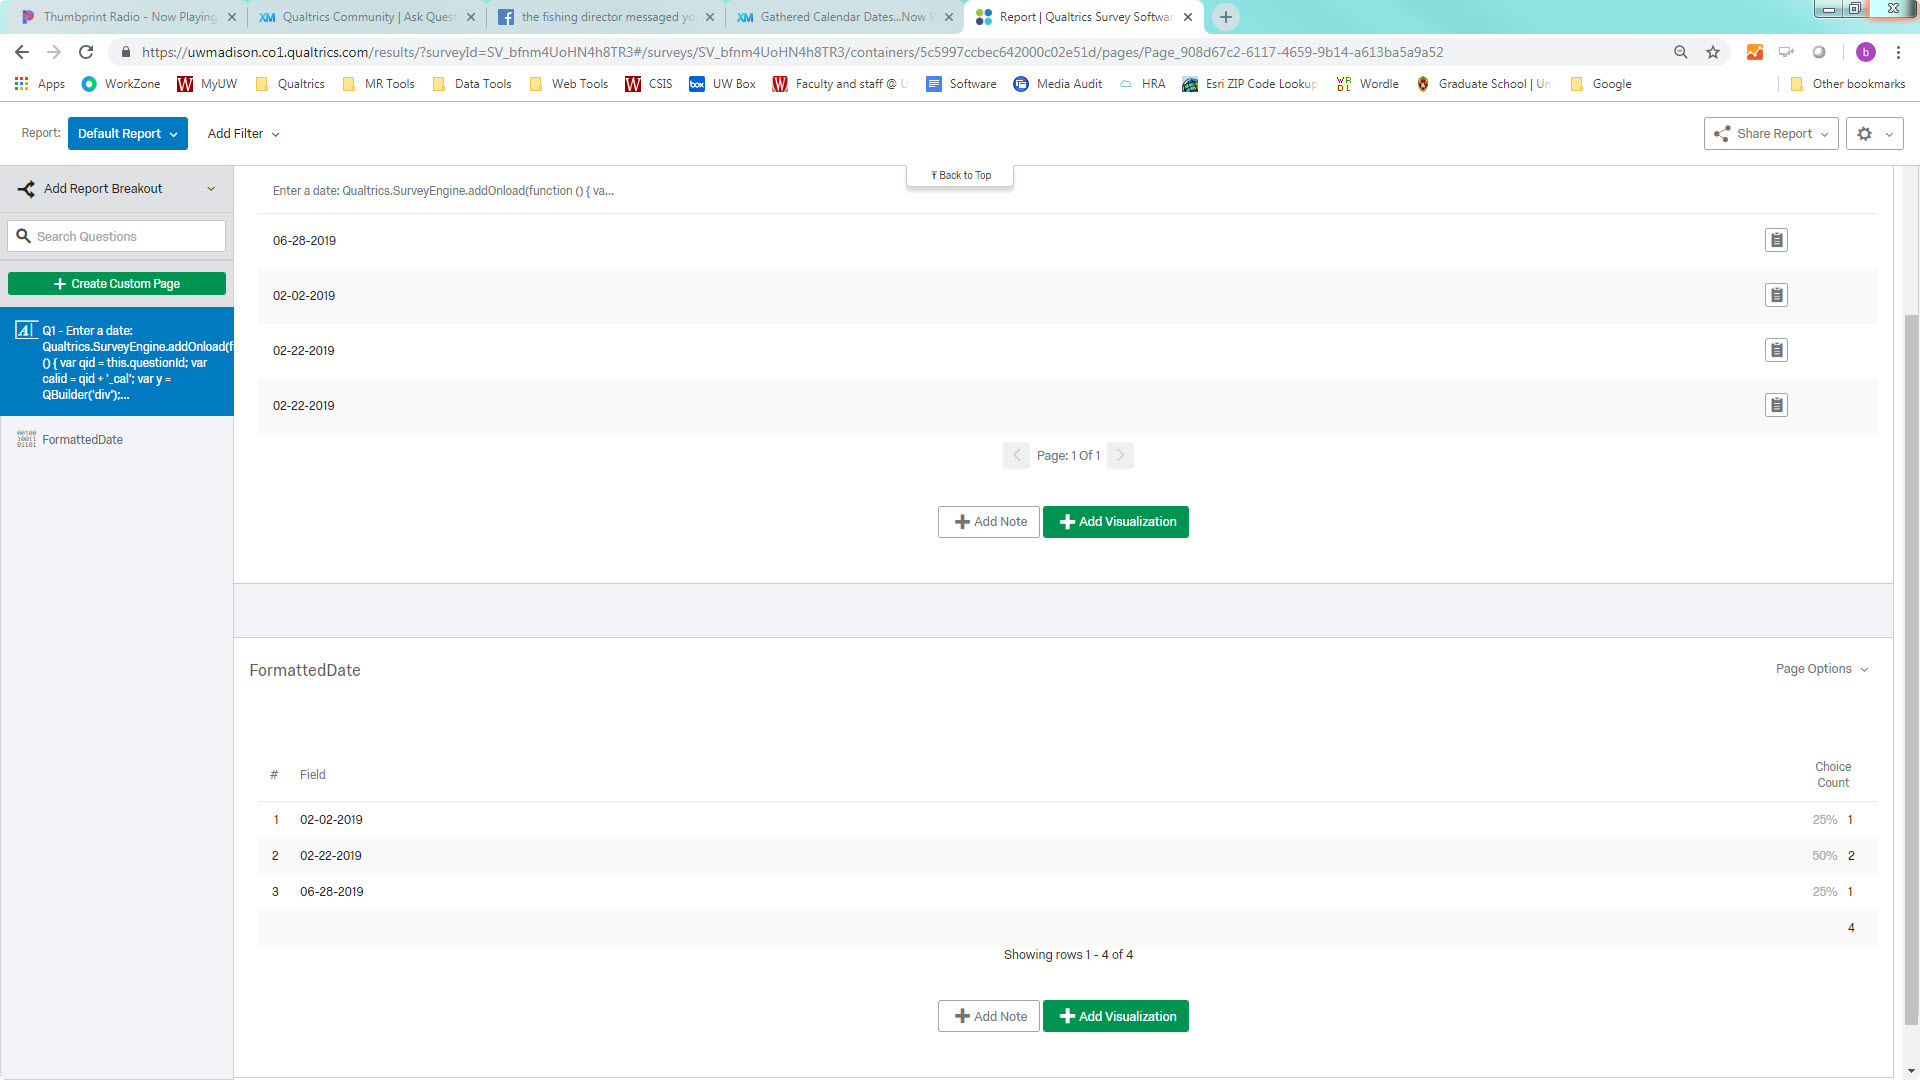
After you do that you will want to add an Element at the end of your
survey flow (I named mine FormattedDate). Then
pipe in your answer to the date question. Under the Embedded Data
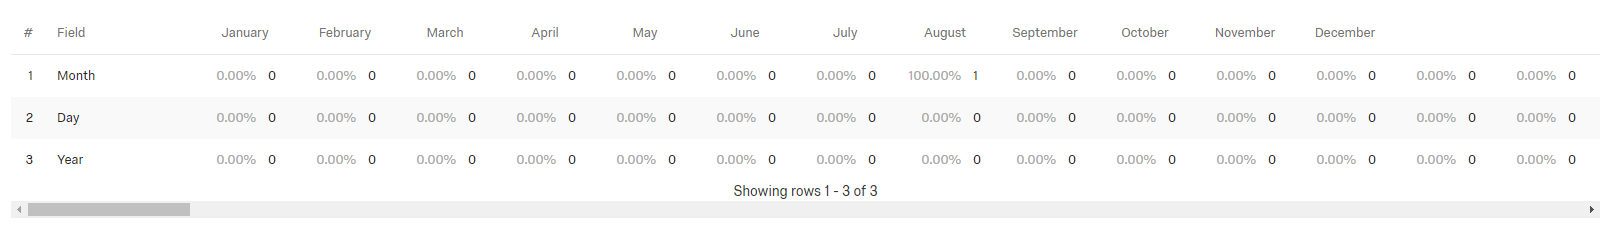
Options, change the value for your variable from Text to Text Set. This will get you the frequency counts you want by date. You can see how the Question (first table) and Embedded Data value show up in reporting from the screen cap below.
!
@bstrahin and @Mslreen, thanks for the help! I've made those edits. Since I only had about 30 responses, I went ahead and changed their survey data to the new question and format.
Unfortunately, that means the FormattedDate Element didn't pull those responses. My only thought is to go back and retake the response for each.
Anyway, thanks so much for the help!