Hello,
I am Giang Pham (Annie), a PhD student at RMIT Melbourne.
I am designing choice experiment (i.e. conjoint Analysis) in Qualtrics based on a template provided online by Kyle A. Dropp. (http://kyledropp.weebly.com/conjoint.html)
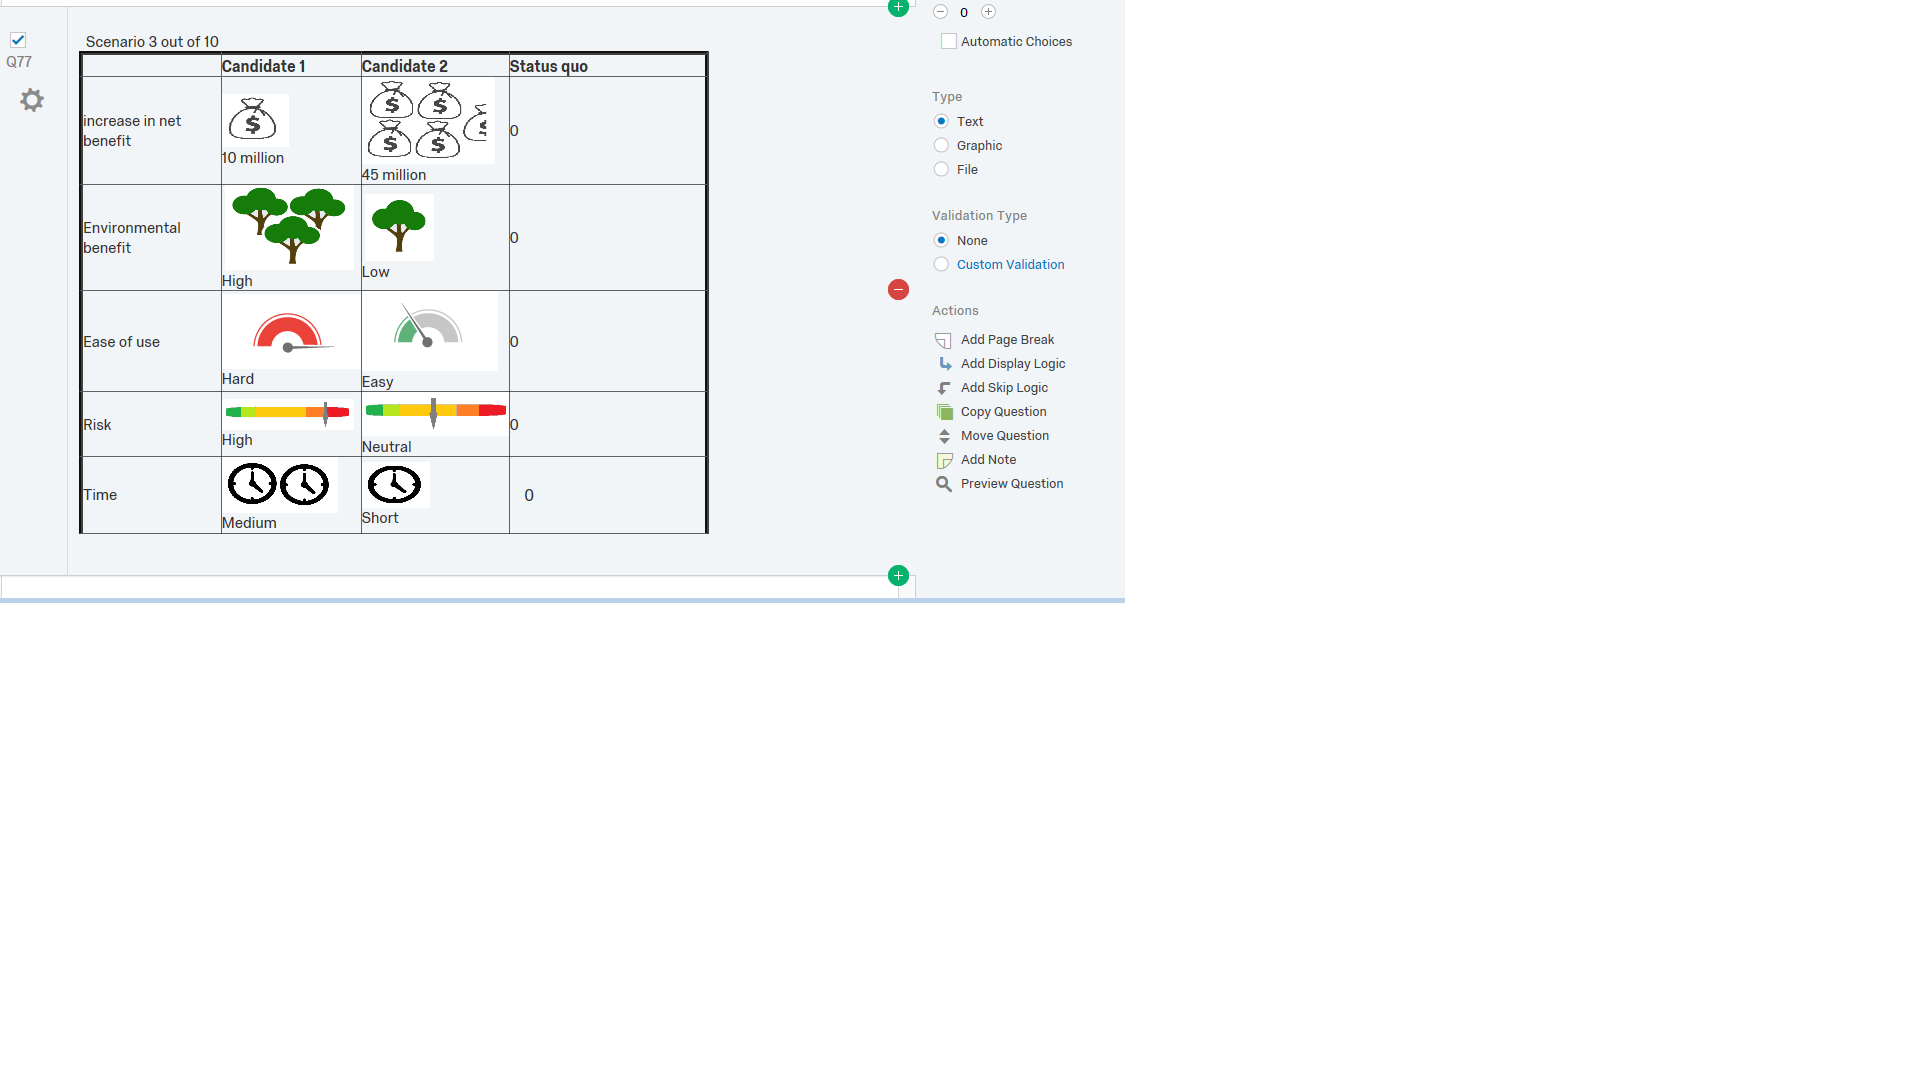
I have followed their instructions but in my experiment I want to add images which allow participants to visualize the levels of each attribute.
However, once I insert images to the given table (which is coded by html code), all of the information on participants’ choices disappears from the data file.
Could anyone please help me solve this problem? If it helps, I could provide an example of the problem using Team Viewer.
Page 1 / 1
I attached some pictures which describe the situation.
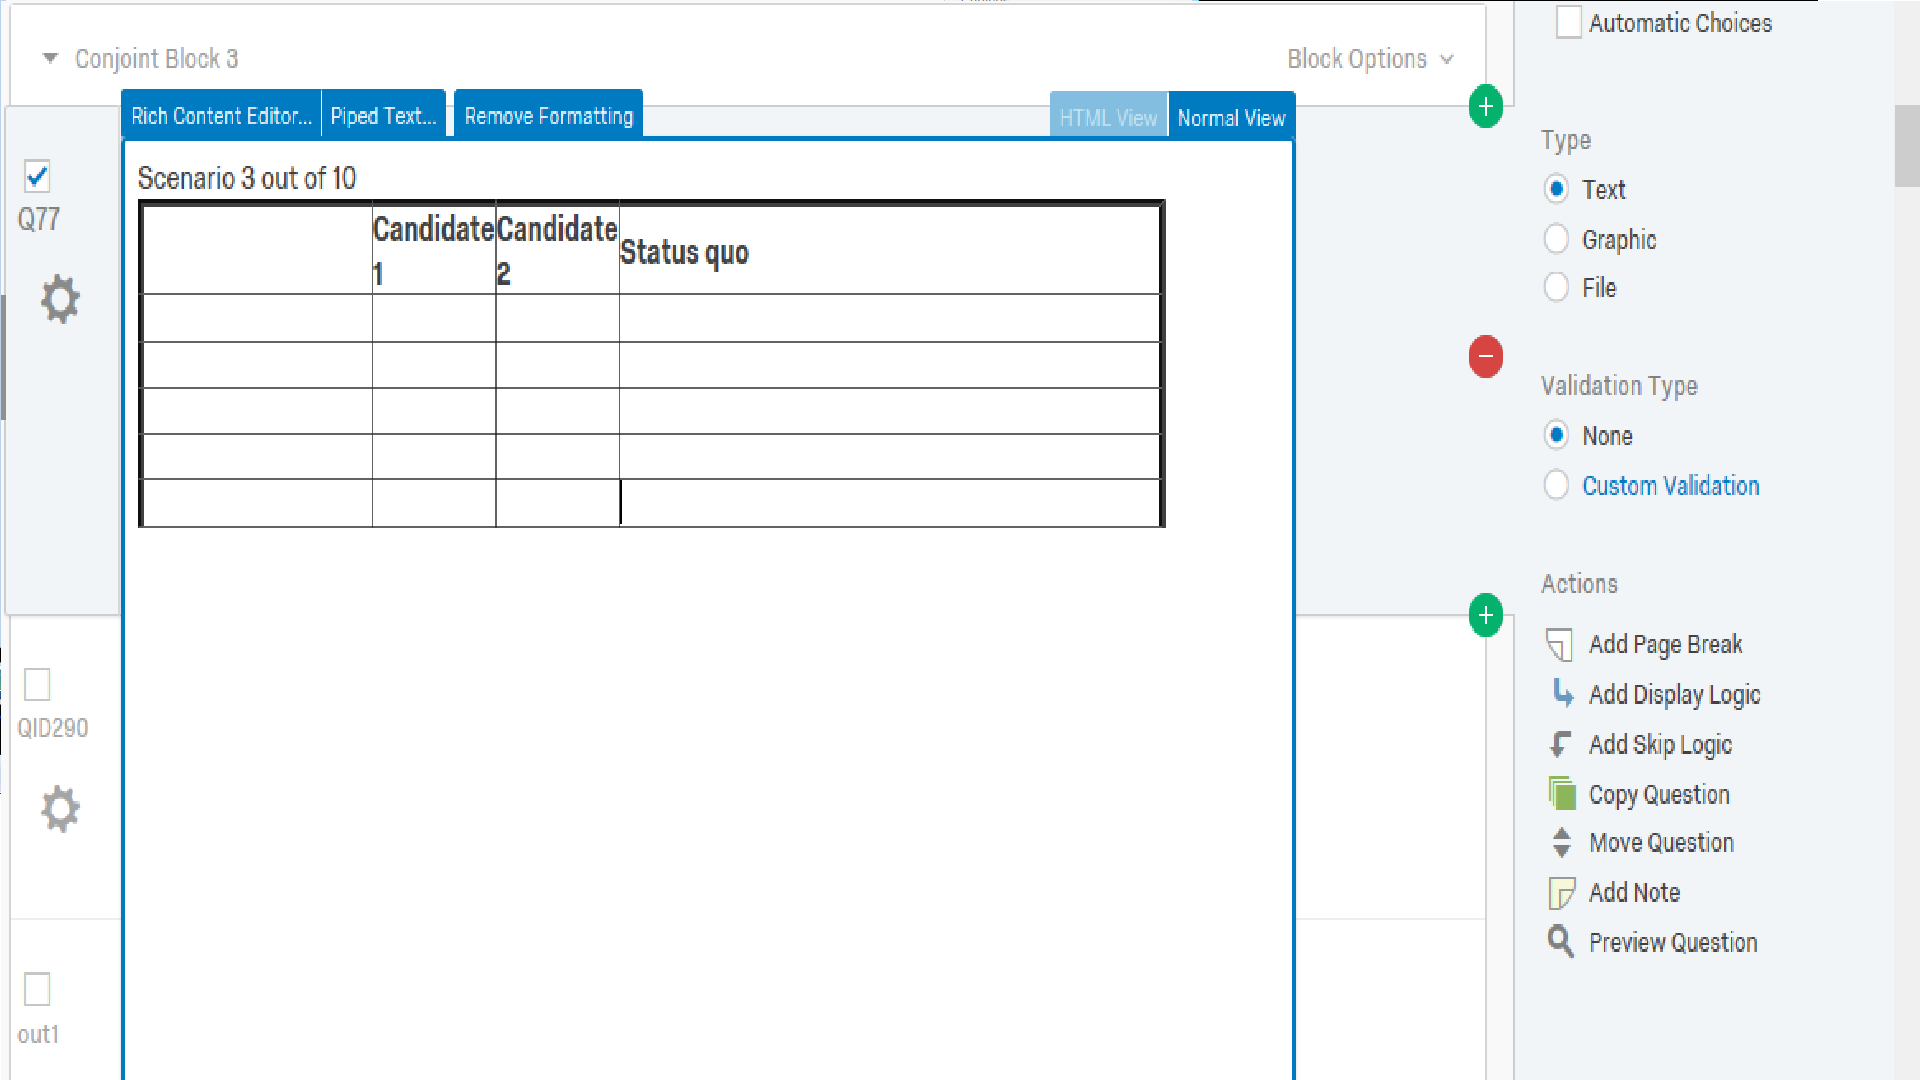
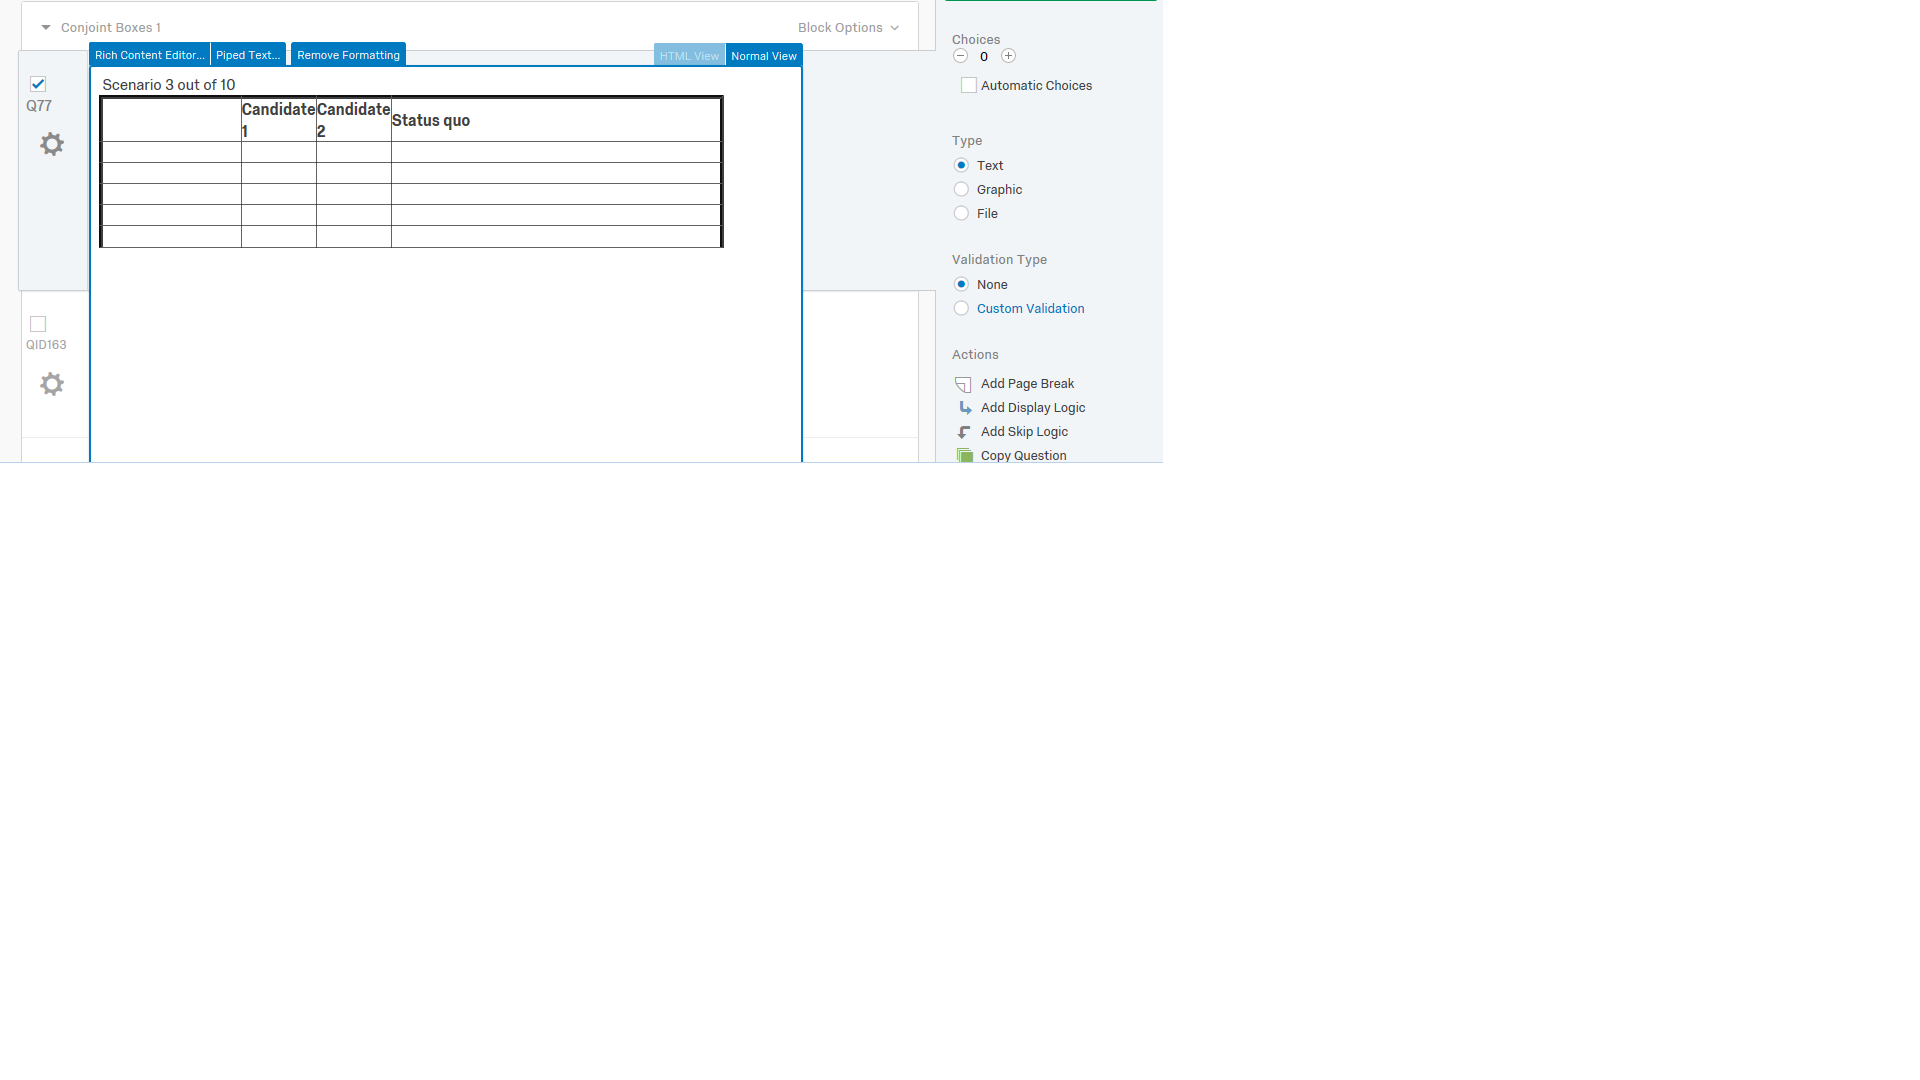
Pic 1: the table appears without information on each box when we look on qualtrics
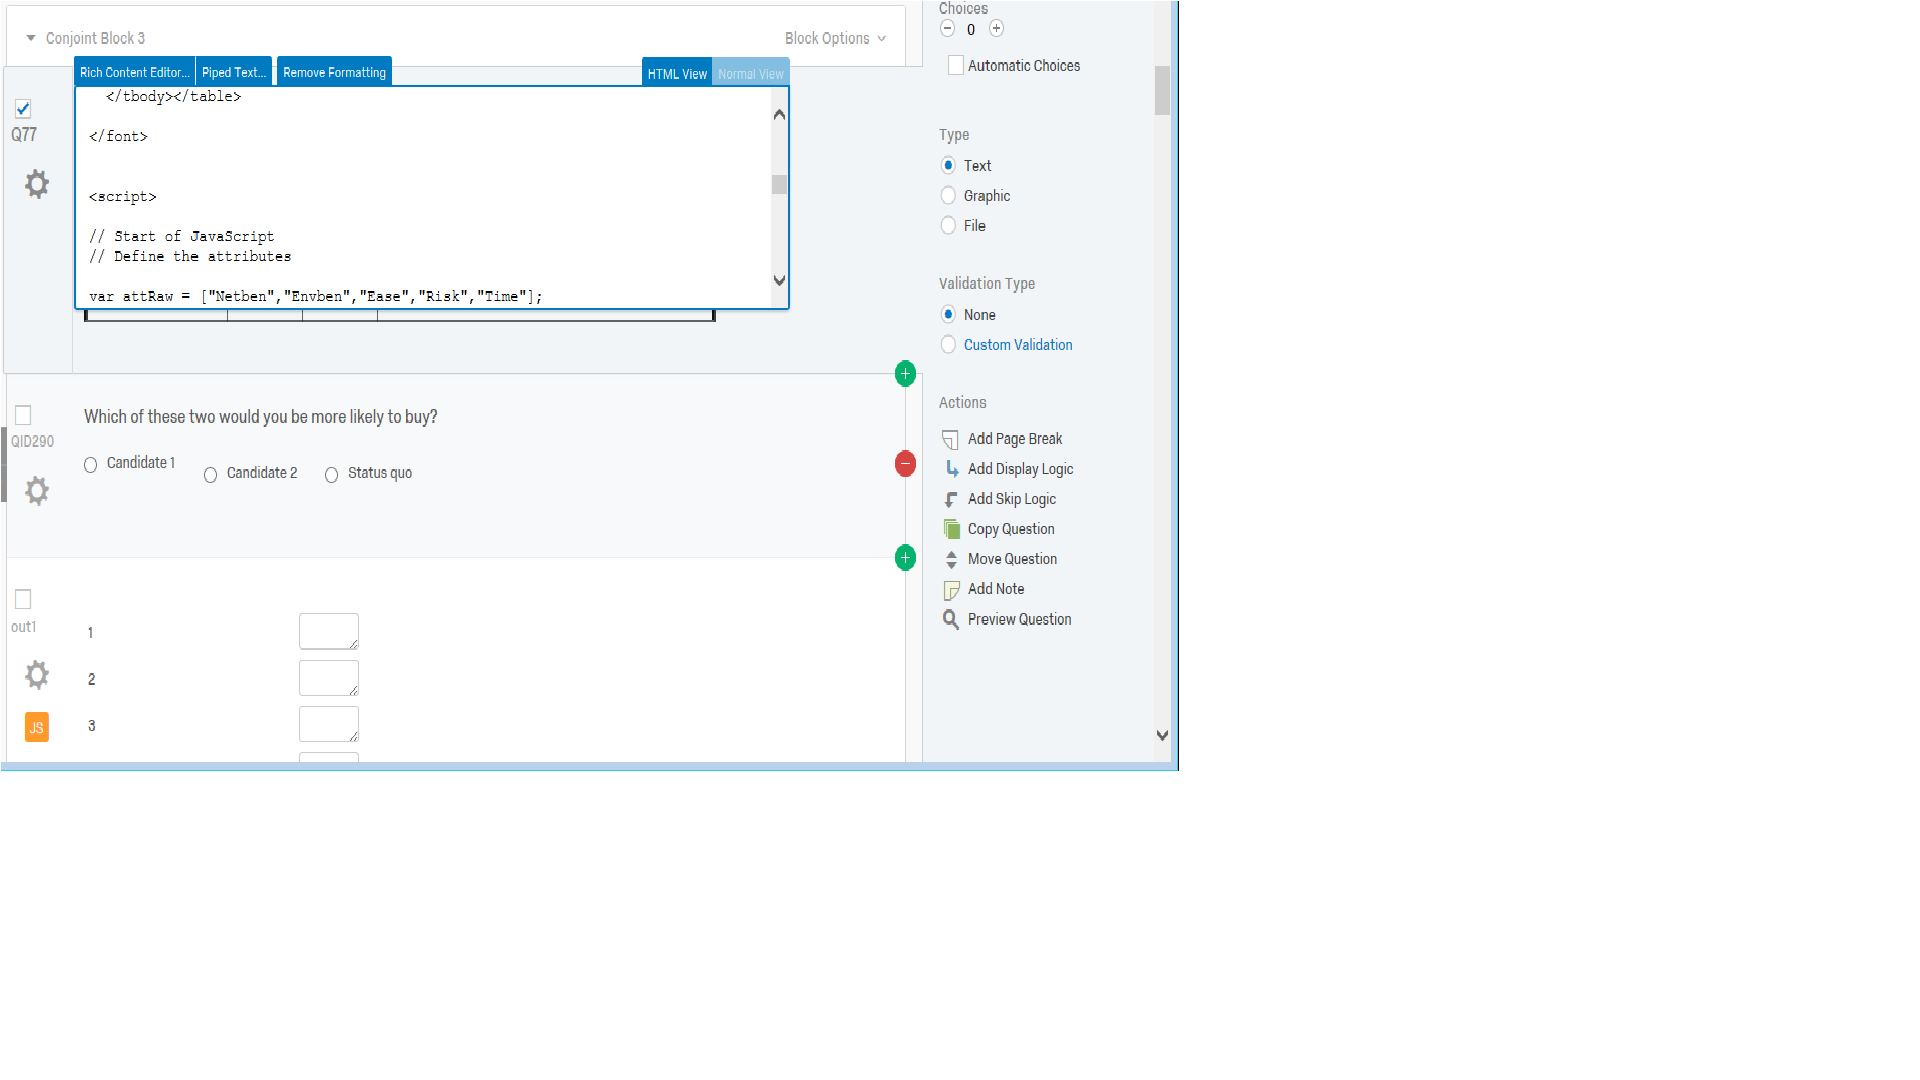
Pic 2: the html coding, which include both coding for table and coding for information in the table (from <script> part)
Pic3: How the question look like when distributing on qualtrics link
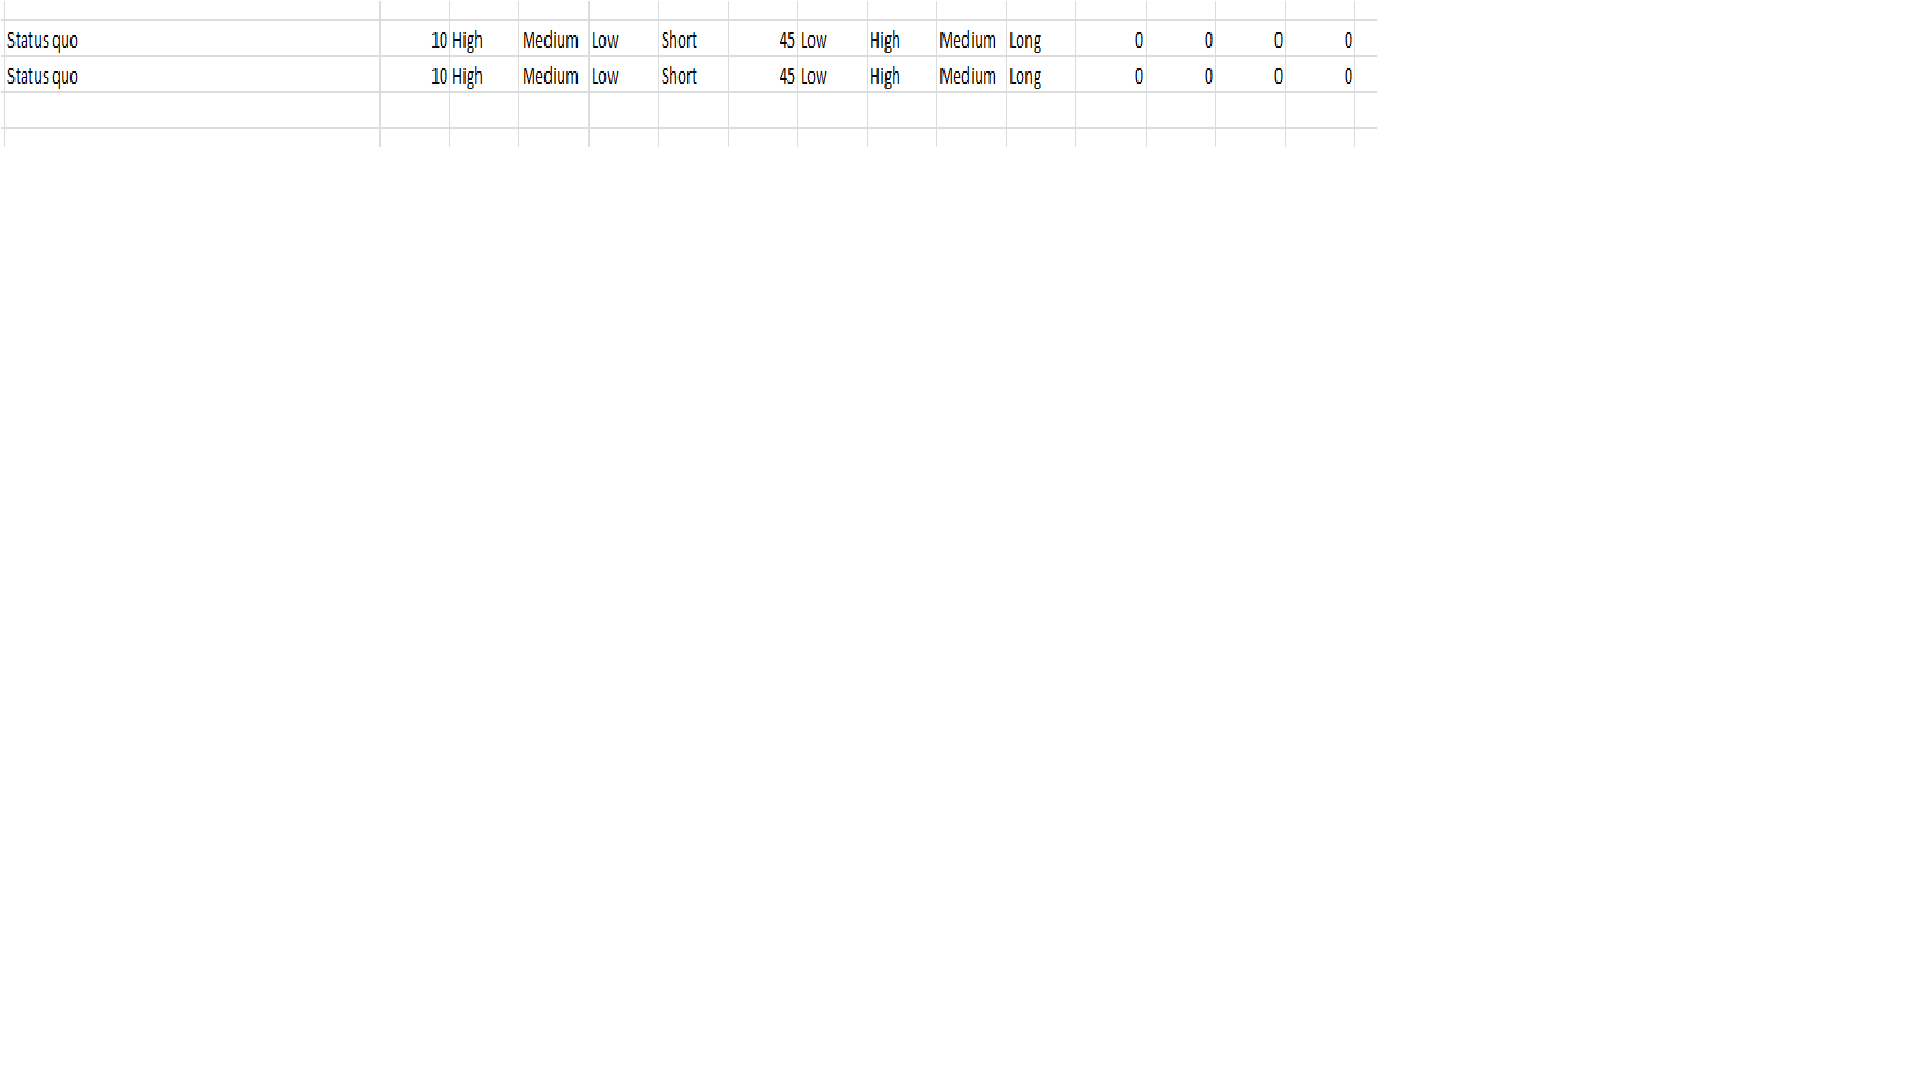
Pic4: When participant choose 1 option, the data will go to an .csv file with information like this.
Pic5: If I use the "Rich content editor", I can insert text, images as shown in pic 5
Pic6: This is the choice set that I want the participant see when they do survey
Pic7: However, after I use the "Rich content editor", when distributing the survey, The data does not come to .csv table as at pic 4. which mean I don't have any information to analyse after conducting survey
!
!
!
!
!
!
!
You probably need to add your images using html. Post the html for your table.
Hi Tom,
Thank you for your response.
This is the html for my table: (I don't know how to show them on this comment. I just copy it and it shows the table )
Sorry I have no idea about html, I am trying to figure it out in the template.
<span> Scenario 1 out of 30 </span>
<font size="3">
<table border="4" cellpadding="15" cellspacing="0" width="90%">
<col width="140">
<col width="30">
<col width="30">
<tbody><tr>
<th><br></th>
<th><b>SAP 1</b></th>
<th><b>SAP 2</b></th>
<th><b>Status quo</b></th>
</tr>
<tr>
<td id="att1__1"><br></td>
<td id="a1__1"><br></td>
<td id="b1__1"><br></td>
<td id="c1__1"><br></td>
</tr>
<tr>
<td id="att2__1"><br></td>
<td id="a2__1"><br></td>
<td id="b2__1"><br></td>
<td id="c2__1"><br></td>
</tr>
<tr>
<td id="att3__1"><br></td>
<td id="a3__1"><br></td>
<td id="b3__1"><br></td>
<td id="c3__1"><br></td>
</tr>
<tr>
<td id="att4__1"><br></td>
<td id="a4__1"><br></td>
<td id="b4__1"><br></td>
<td id="c4__1"><br></td>
</tr>
<tr>
<td id="att5__1"><br></td>
<td id="a5__1"><br></td>
<td id="b5__1"><br></td>
<td id="c5__1"><br></td>
</tr>
<tr>
</tr>
</tbody></table>
</font>
</span>
...
That isn't html. Html for a table would look something like:
```
<table><tr><td>SAP</td>
```
etc.
```
<table><tr><td>SAP</td>
```
etc.
Hi Tom,
I copy and paste the html code on previous comment but it appear like a table.
So, I copy into words and attach to this comment. Could you please have a look and suggest me solutions?
Thank you very much ^_^
I copy and paste the html code on previous comment but it appear like a table.
So, I copy into words and attach to this comment. Could you please have a look and suggest me solutions?
Thank you very much ^_^
Edit your html to add the images (don't use Qualtrics insert image). For example:
```
<tr>
<td id="att1__1">Row label text</td>
<td id="a1__1"><img src="_insert_image_url_" alt="_insert_image_description_"><br>Text below image</td>
<td id="b1__1"><img src="_insert_image_url_" alt="_insert_image_description_"><br>Text below image</td>
<td id="c1__1">0</td>
</tr>
```
You may need a style attribute on your images to size them correctly if they aren't already.
```
<tr>
<td id="att1__1">Row label text</td>
<td id="a1__1"><img src="_insert_image_url_" alt="_insert_image_description_"><br>Text below image</td>
<td id="b1__1"><img src="_insert_image_url_" alt="_insert_image_description_"><br>Text below image</td>
<td id="c1__1">0</td>
</tr>
```
You may need a style attribute on your images to size them correctly if they aren't already.
Thank you very much Tom.
It is very helpful.
Annie
It is very helpful.
Annie
Hi,
This is probably a bit late for the initiators of this discussion, but hopefully this might be helpful to others facing similar issues.
I have written a short article in which I describe how to create a discrete choice experiment of the form that is discussed above. The paper is entitled "A Step-by-Step Procedure to Implement Discrete Choice Experiments in Qualtrics" and it is published in the Social Science Computer Review.
I hope this helps!
Best regards,
Sylvain
Leave a Reply
Enter your E-mail address. We'll send you an e-mail with instructions to reset your password.