I have an intranet renaming contest where the first round of votes is narrowing down to the top 10 from 48 submissions.
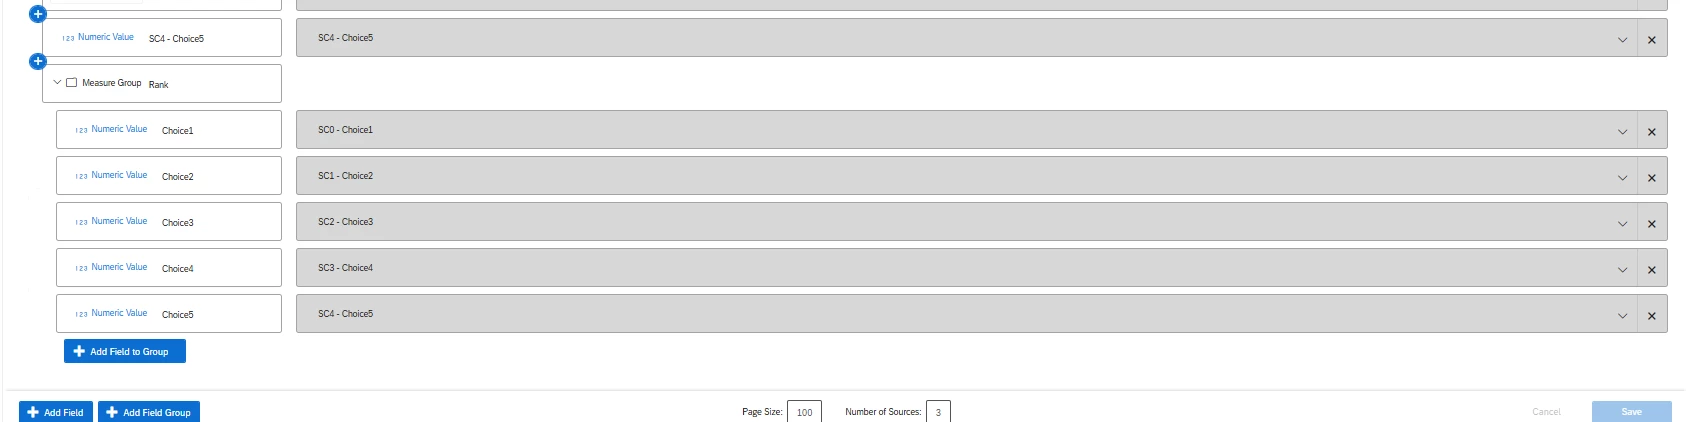
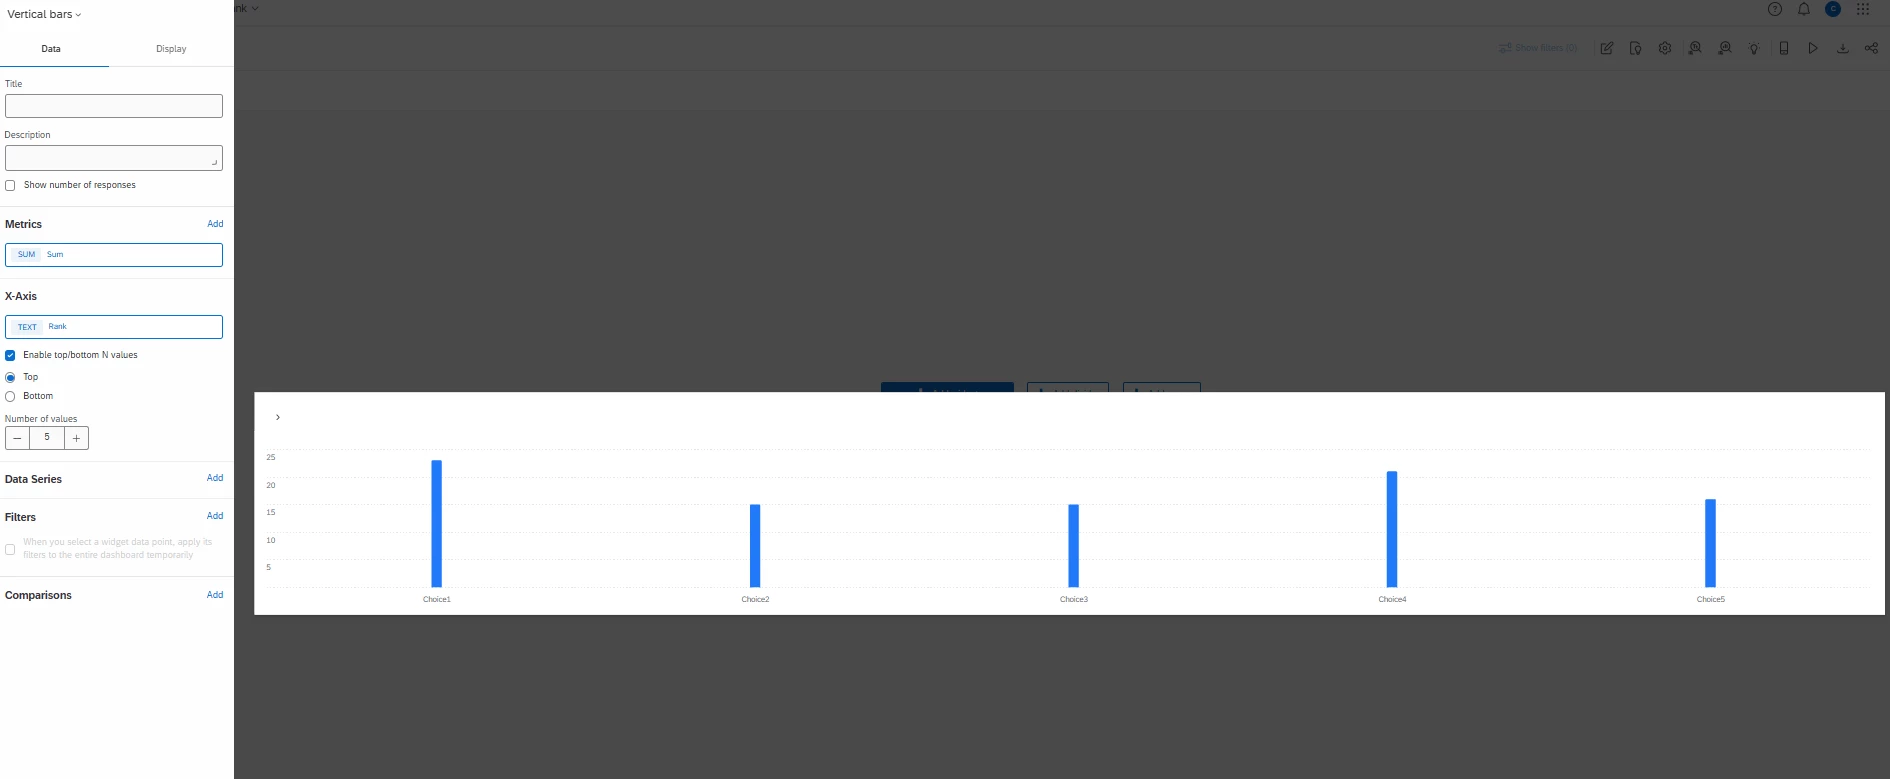
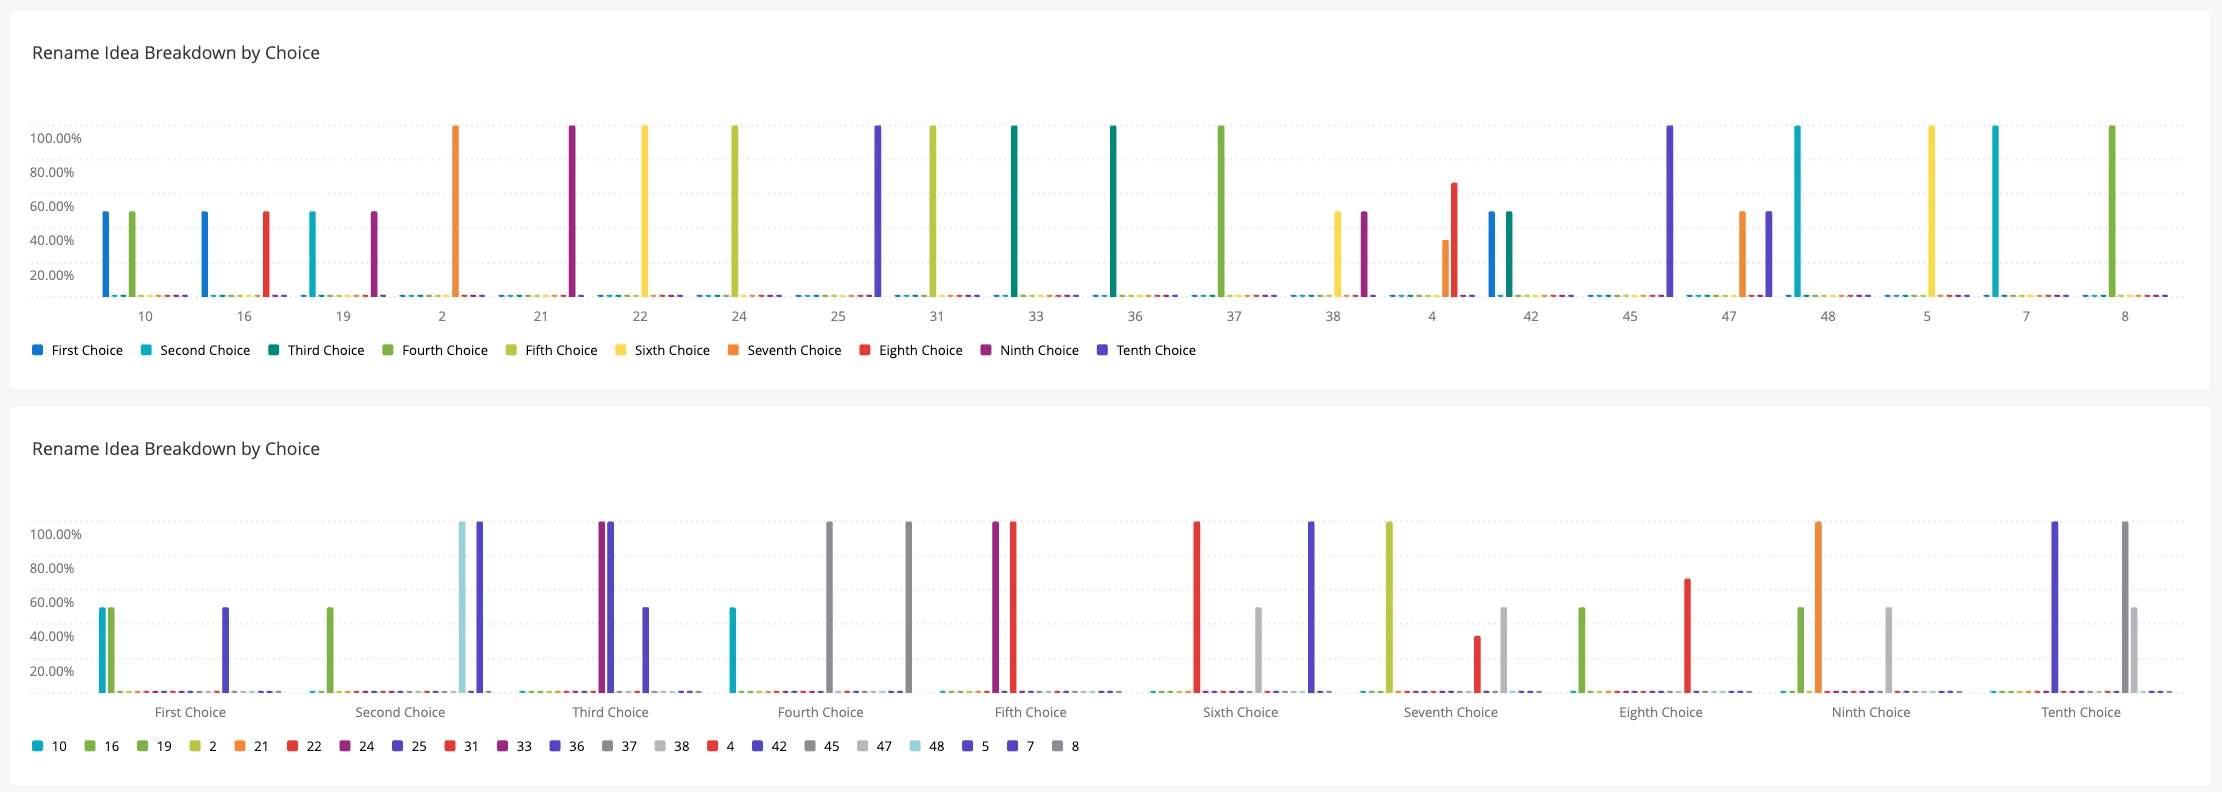
I’m trying to figure out a way to best display this within a dashboard. I have the two widgets below but since I’m using a measure group, the values and not the labels are coming in. Both of these graphs don’t really help the decision makers easily figure out which are the top 10 amongst all the individuals who voted.
I chose to use 10 different multiple choice questions instead of the rank order question because they only have to rank 10 out of 48 and the rank question didn’t seem to be the best user experience for that. I also have it so that each question only carries forward the Unselected options so previously selected choices are removed from the remaining choices.
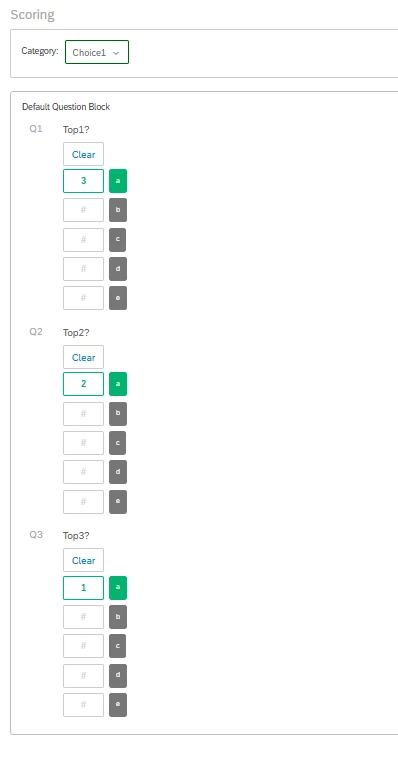
I thought maybe I could attach a score to each question (First to Tenth choices = 1-10 points respectively). Lowest score would rank the highest. However, I’m not able to figure out how to tie that in to have it be a summary of the scores per each name from that list of 48 that have been voted for.
I want to be able to show that Name1 scored 11 points (it was voted as first choice and tenth choices), Name2 score 15 points (it was voted as first, fifth and tenth choices), etc. Then be able to sort that from lowest to highest. Where the lowest 10 move onto the next round.