Hey colleagues,
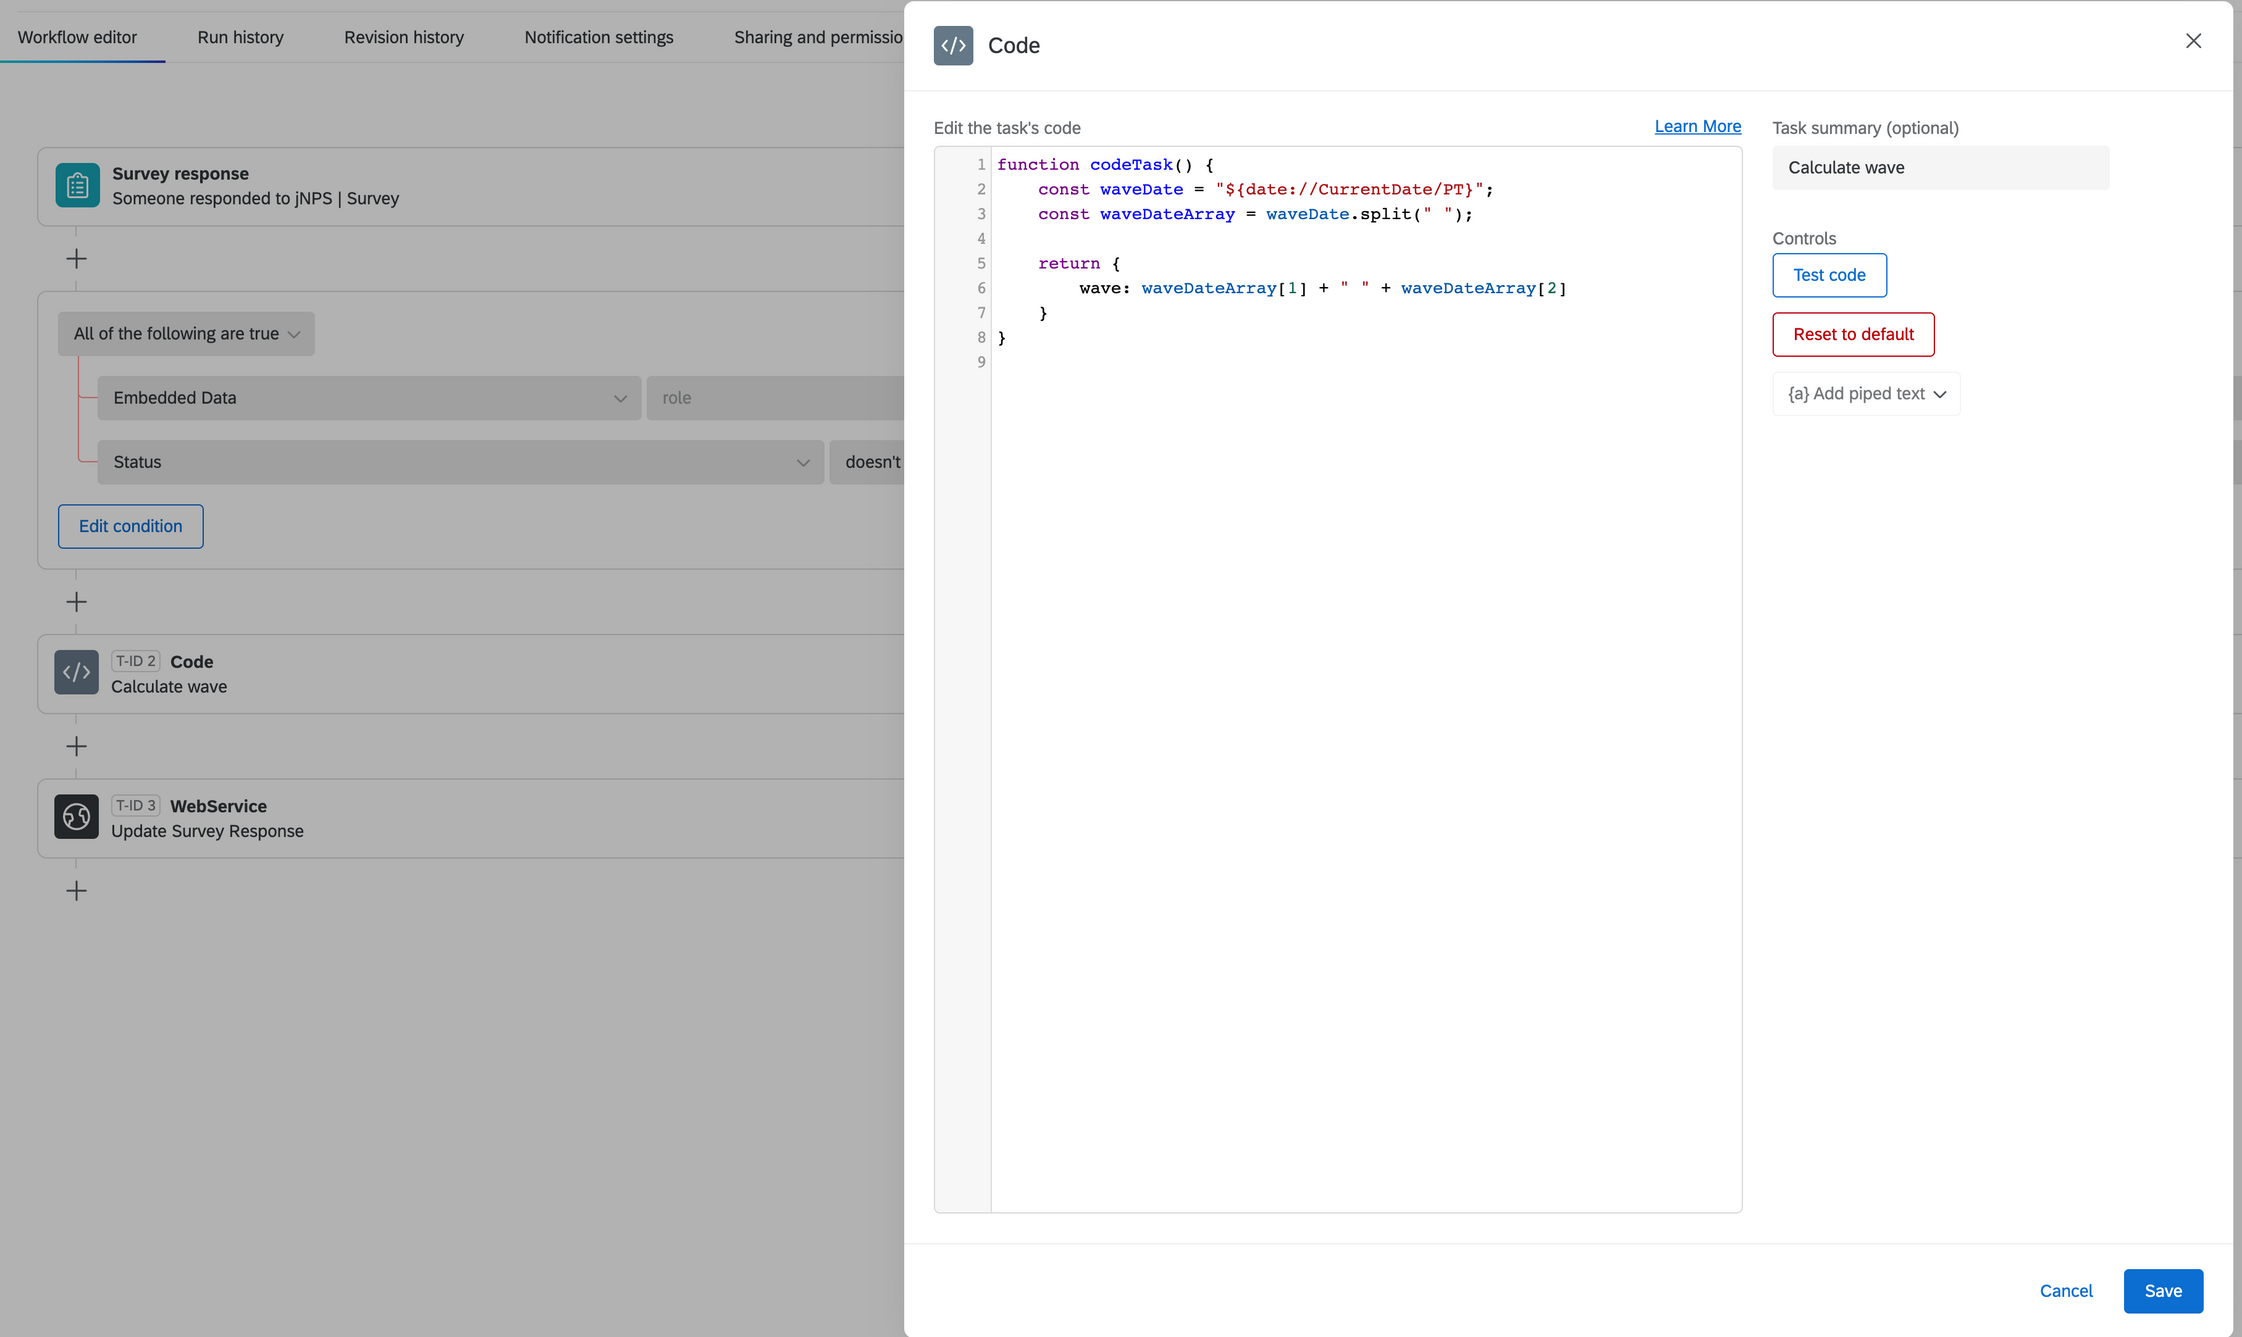
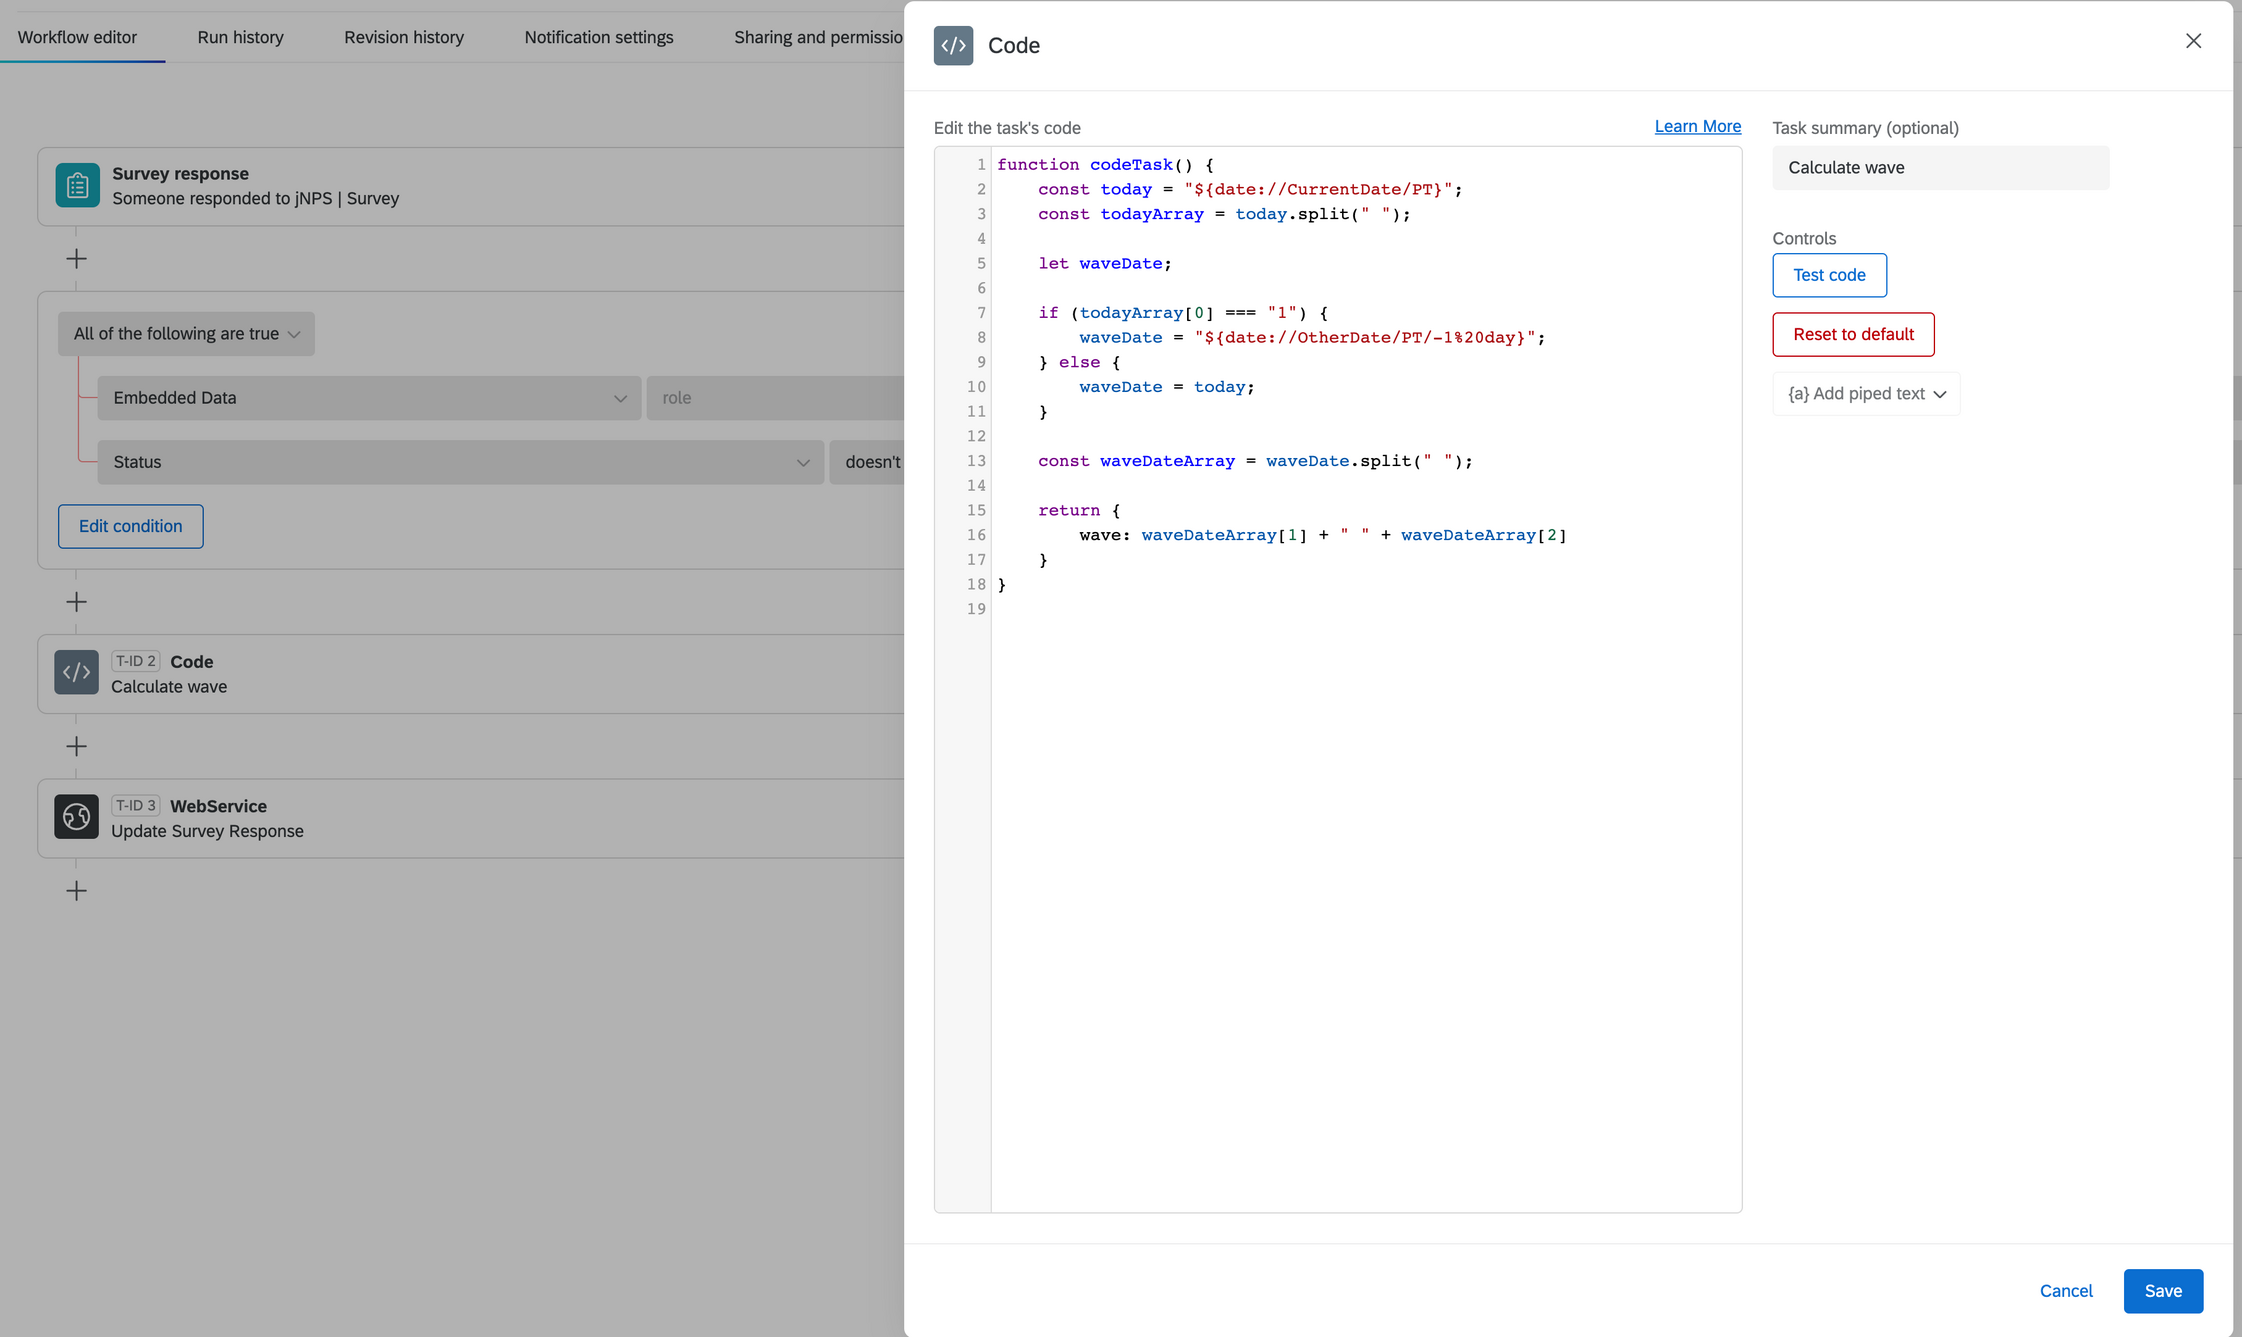
We have a question regarding an adhoc wave field created. This "wave" field works different depending of "role" field (embedded data), for the 2 types of roles we have: Role1 and Role2. The wave field has already created as follows. Also a screenshot how it has been defined in Qualtrics, basically as a "workflow" that adds this info once interview is finished.
Role1: First of each month - Last day of each month
- January wave: from 1st Jan to 31st Jan. All January interactions are evaluated by Role1 (interviews completed) between 1st Jan to 31th Jan.
- February wave: from 1st Feb to 28th Feb. ...
- ...
- December wave: from 1st Dec to 31st Dec. ...

Role2: Second of each month - First of each month.
- January wave: from 2nd Jan to 1st Feb. All January rides are evaluated by passengers (interviews completed) between 2nd Jan to 1st Feb.
- February wave: from 2nd Feb to 1st Marc
- ...
- December wave: from 2nd Dec to 1st Jan
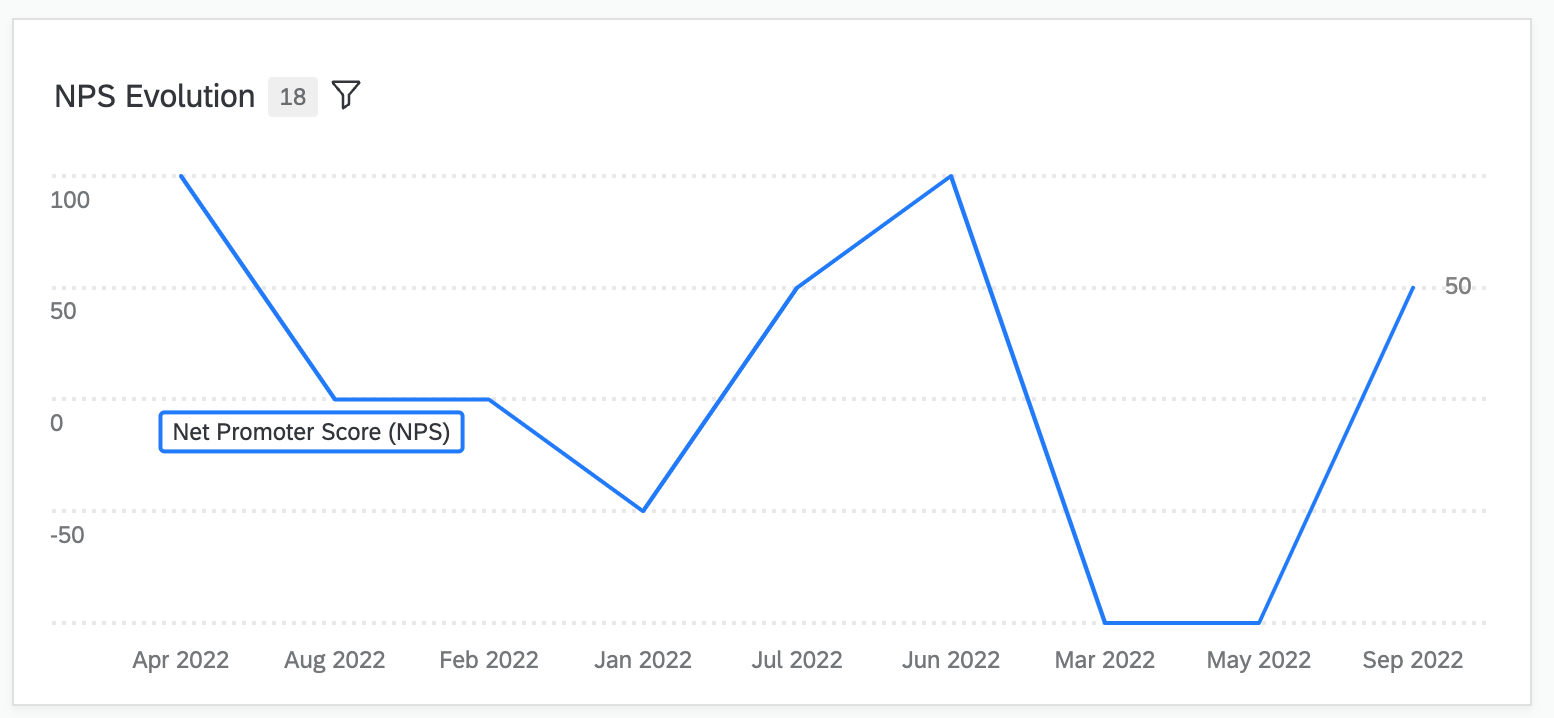
 Our main concern is when using this "wave" info for widgets as it works but the problem is not well recognised as date field for evolution (see image), it is located in a A-Z order:
  Would you know a way to use this field in a proper way to be used for evolution graphs?
Thanks!


 My question is if that would be possible to 'automate' it somehow for instance by creating 'something' in the Data & Analysis tab.
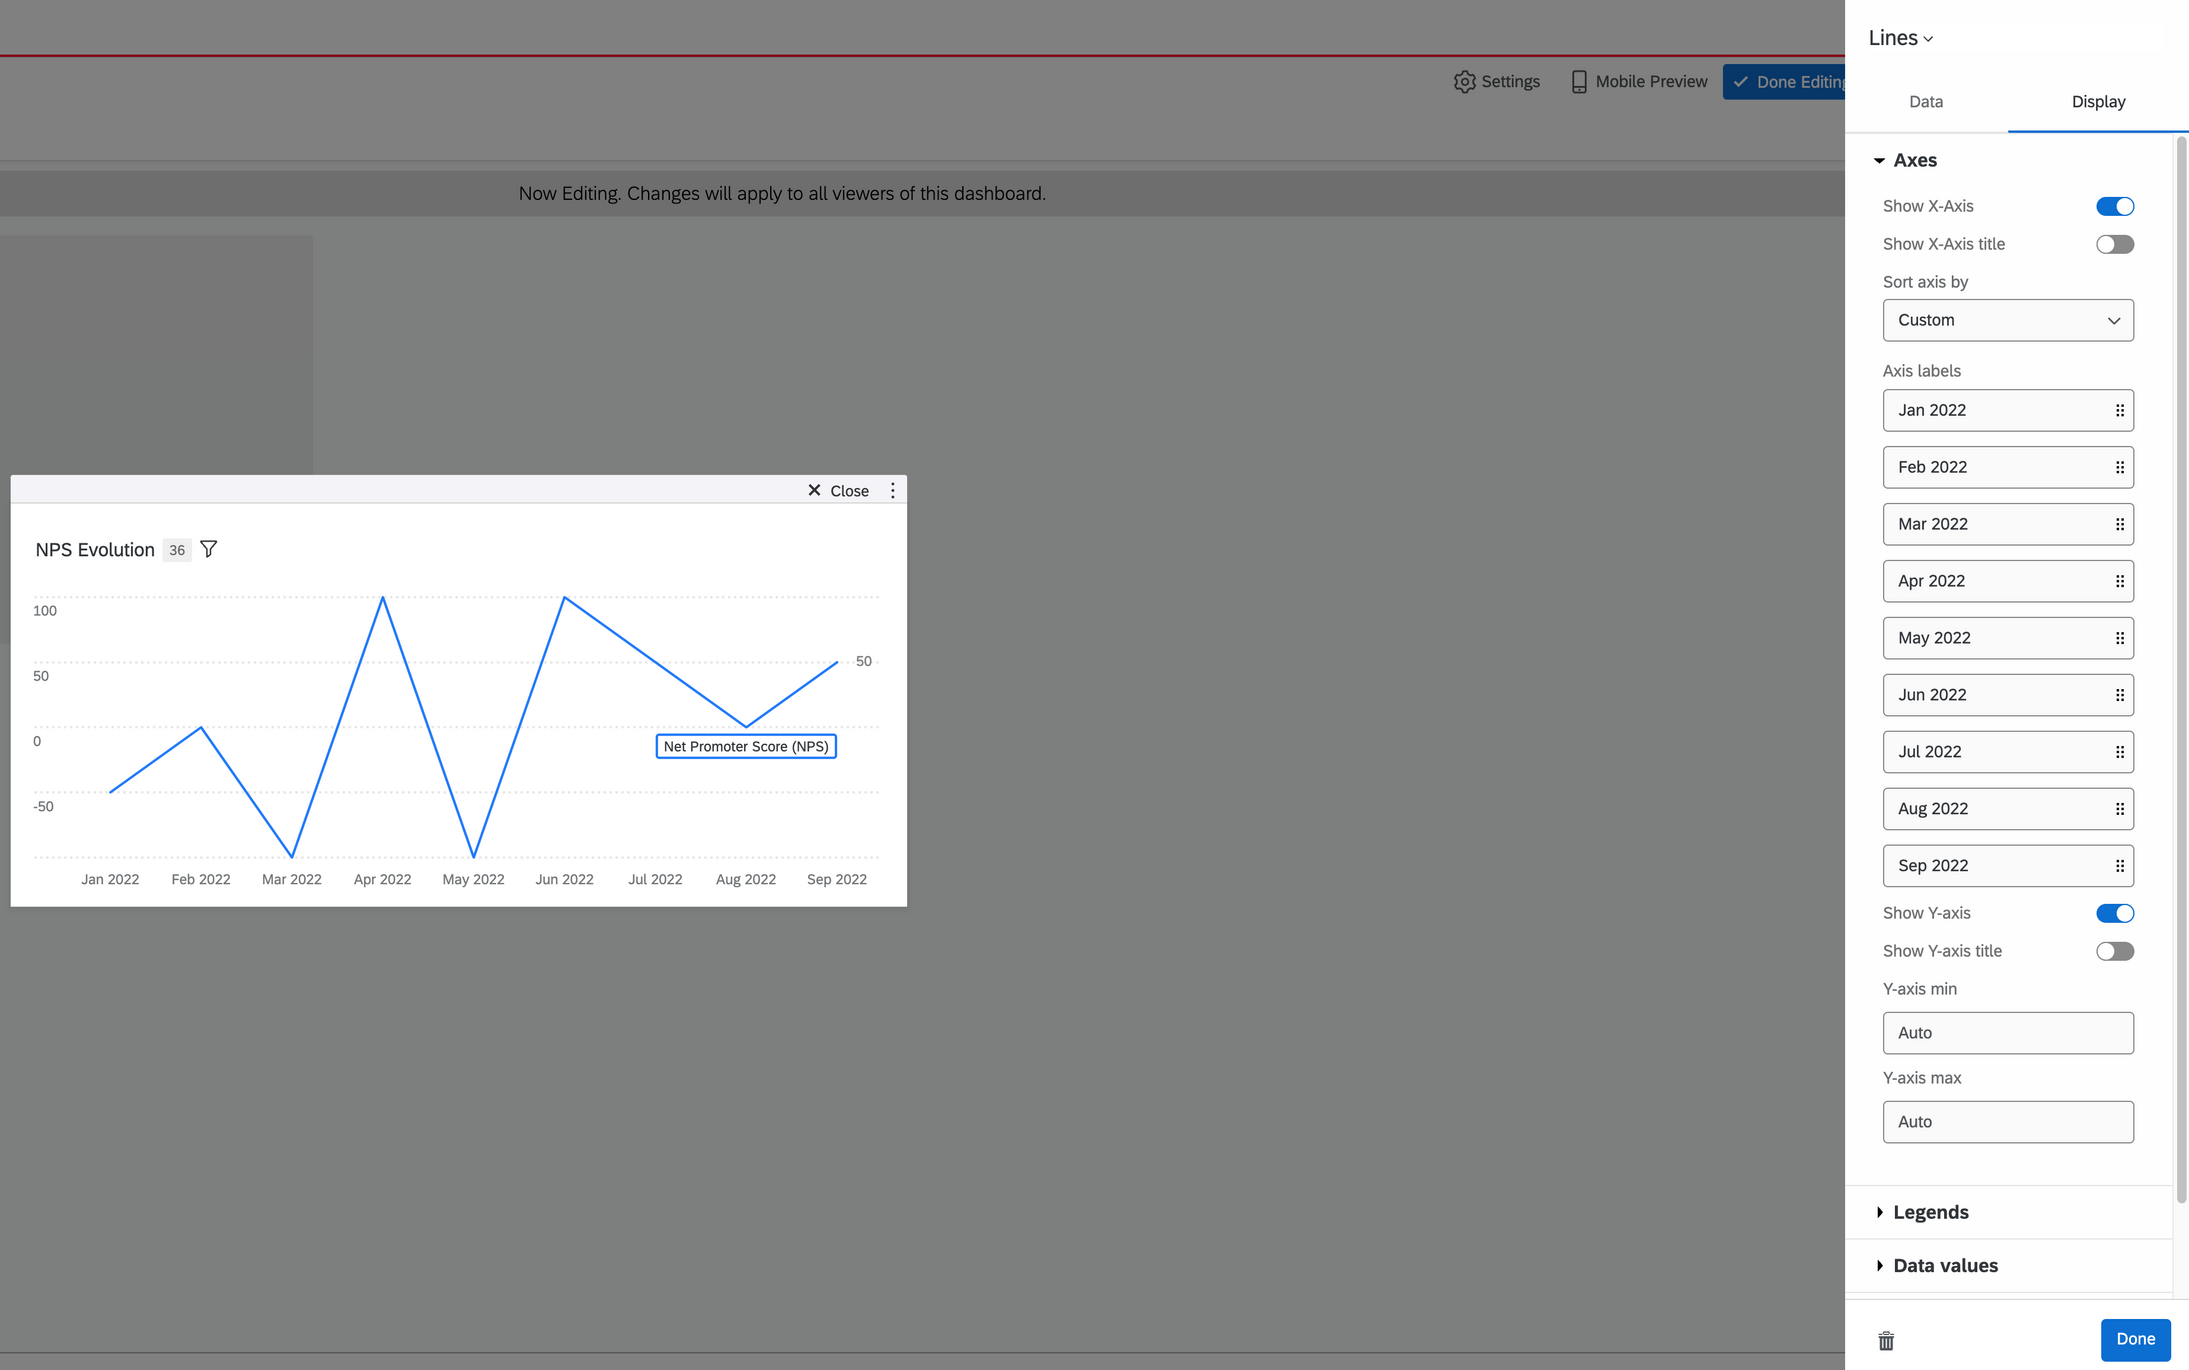
 You can add a wave to your graphic like that :