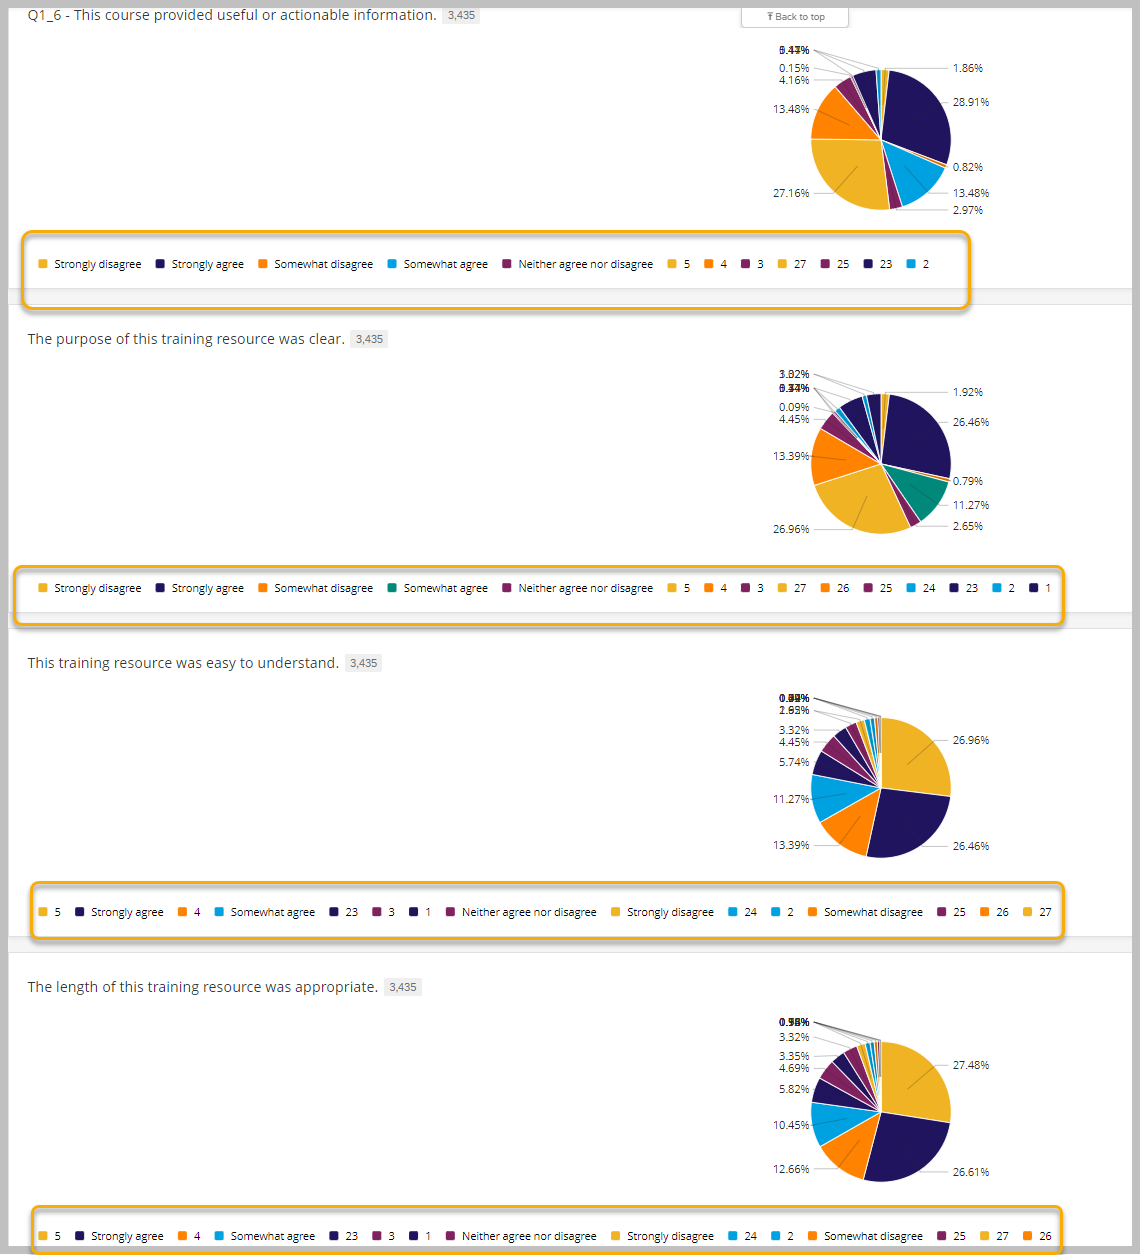
 So I built out a dashboard to collect the responses to all of the end-of-course satisfaction surveys that people take when finishing a training module. Right now we have 70 courses with surveys, and up until last year, they all looks normal.
But then around November last year, something odd happened, the numbers started breaking out into smaller sub-numbers that weren't initially understandable. I since found out that somehow the coding went wonky and I went in and recoded all of these new numbers to the corresponding responses that were initially set, and at first, it worked....they all merged into their respective data sets.
And then again recently, it did it all again....but this time when I go to recode the responses exactly as I did before....they did NOT pull together into the same categories, they are staying as these smaller sub-numbers and is making reporting on the data EXTREMELY difficult.
How can I get this to straighten itself out?
Dashboard won't integrate responses correctly
Sign up
Already have an account? Login

Welcome! To join the Qualtrics Experience Community, log in with your existing Qualtrics credentials below.
Confirm your username, share a bit about yourself, Once your account has been approved by our admins then you're ready to explore and connect .
Free trial account? No problem. Log in with your trial credentials to join.
No free trial account? No problem! Register here
Already a member? Hi and welcome back! We're glad you're here 🙂
You will see the Qualtrics login page briefly before being taken to the Experience Community
Login with Qualtrics

Welcome! To join the Qualtrics Experience Community, log in with your existing Qualtrics credentials below.
Confirm your username, share a bit about yourself, Once your account has been approved by our admins then you're ready to explore and connect .
Free trial account? No problem. Log in with your trial credentials to join. No free trial account? No problem! Register here
Already a member? Hi and welcome back! We're glad you're here 🙂
You will see the Qualtrics login page briefly before being taken to the Experience Community
Login to the Community

Welcome! To join the Qualtrics Experience Community, log in with your existing Qualtrics credentials below.
Confirm your username, share a bit about yourself, Once your account has been approved by our admins then you're ready to explore and connect .
Free trial account? No problem. Log in with your trial credentials to join.
No free trial account? No problem! Register here
Already a member? Hi and welcome back! We're glad you're here 🙂
You will see the Qualtrics login page briefly before being taken to the Experience Community
Login with Qualtrics

Welcome! To join the Qualtrics Experience Community, log in with your existing Qualtrics credentials below.
Confirm your username, share a bit about yourself, Once your account has been approved by our admins then you're ready to explore and connect .
Free trial account? No problem. Log in with your trial credentials to join. No free trial account? No problem! Register here
Already a member? Hi and welcome back! We're glad you're here 🙂
You will see the Qualtrics login page briefly before being taken to the Experience Community
Enter your E-mail address. We'll send you an e-mail with instructions to reset your password.


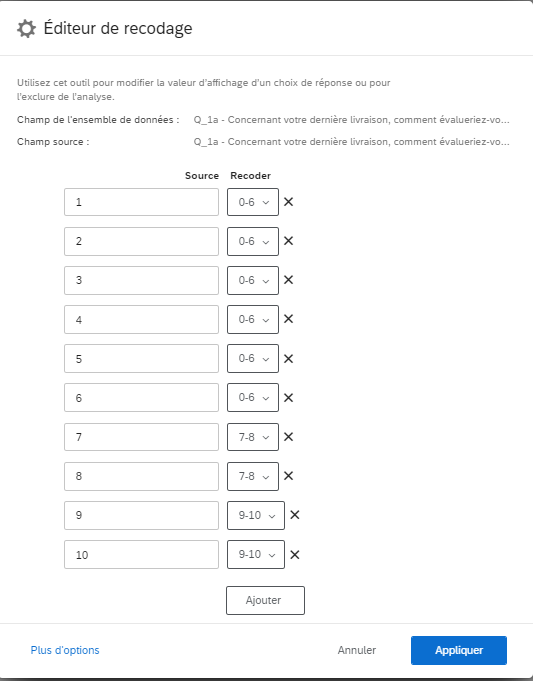
 Hello you should go and see in the dashboard data if the values are well coded in the recoding editor of a text set variable for example: