Gauge chart range display on hover in CX dashboard | XM Community
Skip to main content
Question

Gauge chart range display on hover in CX dashboard

  • November 18, 2025
  • 1 reply
  • 10 views

Forum|alt.badge.img+4

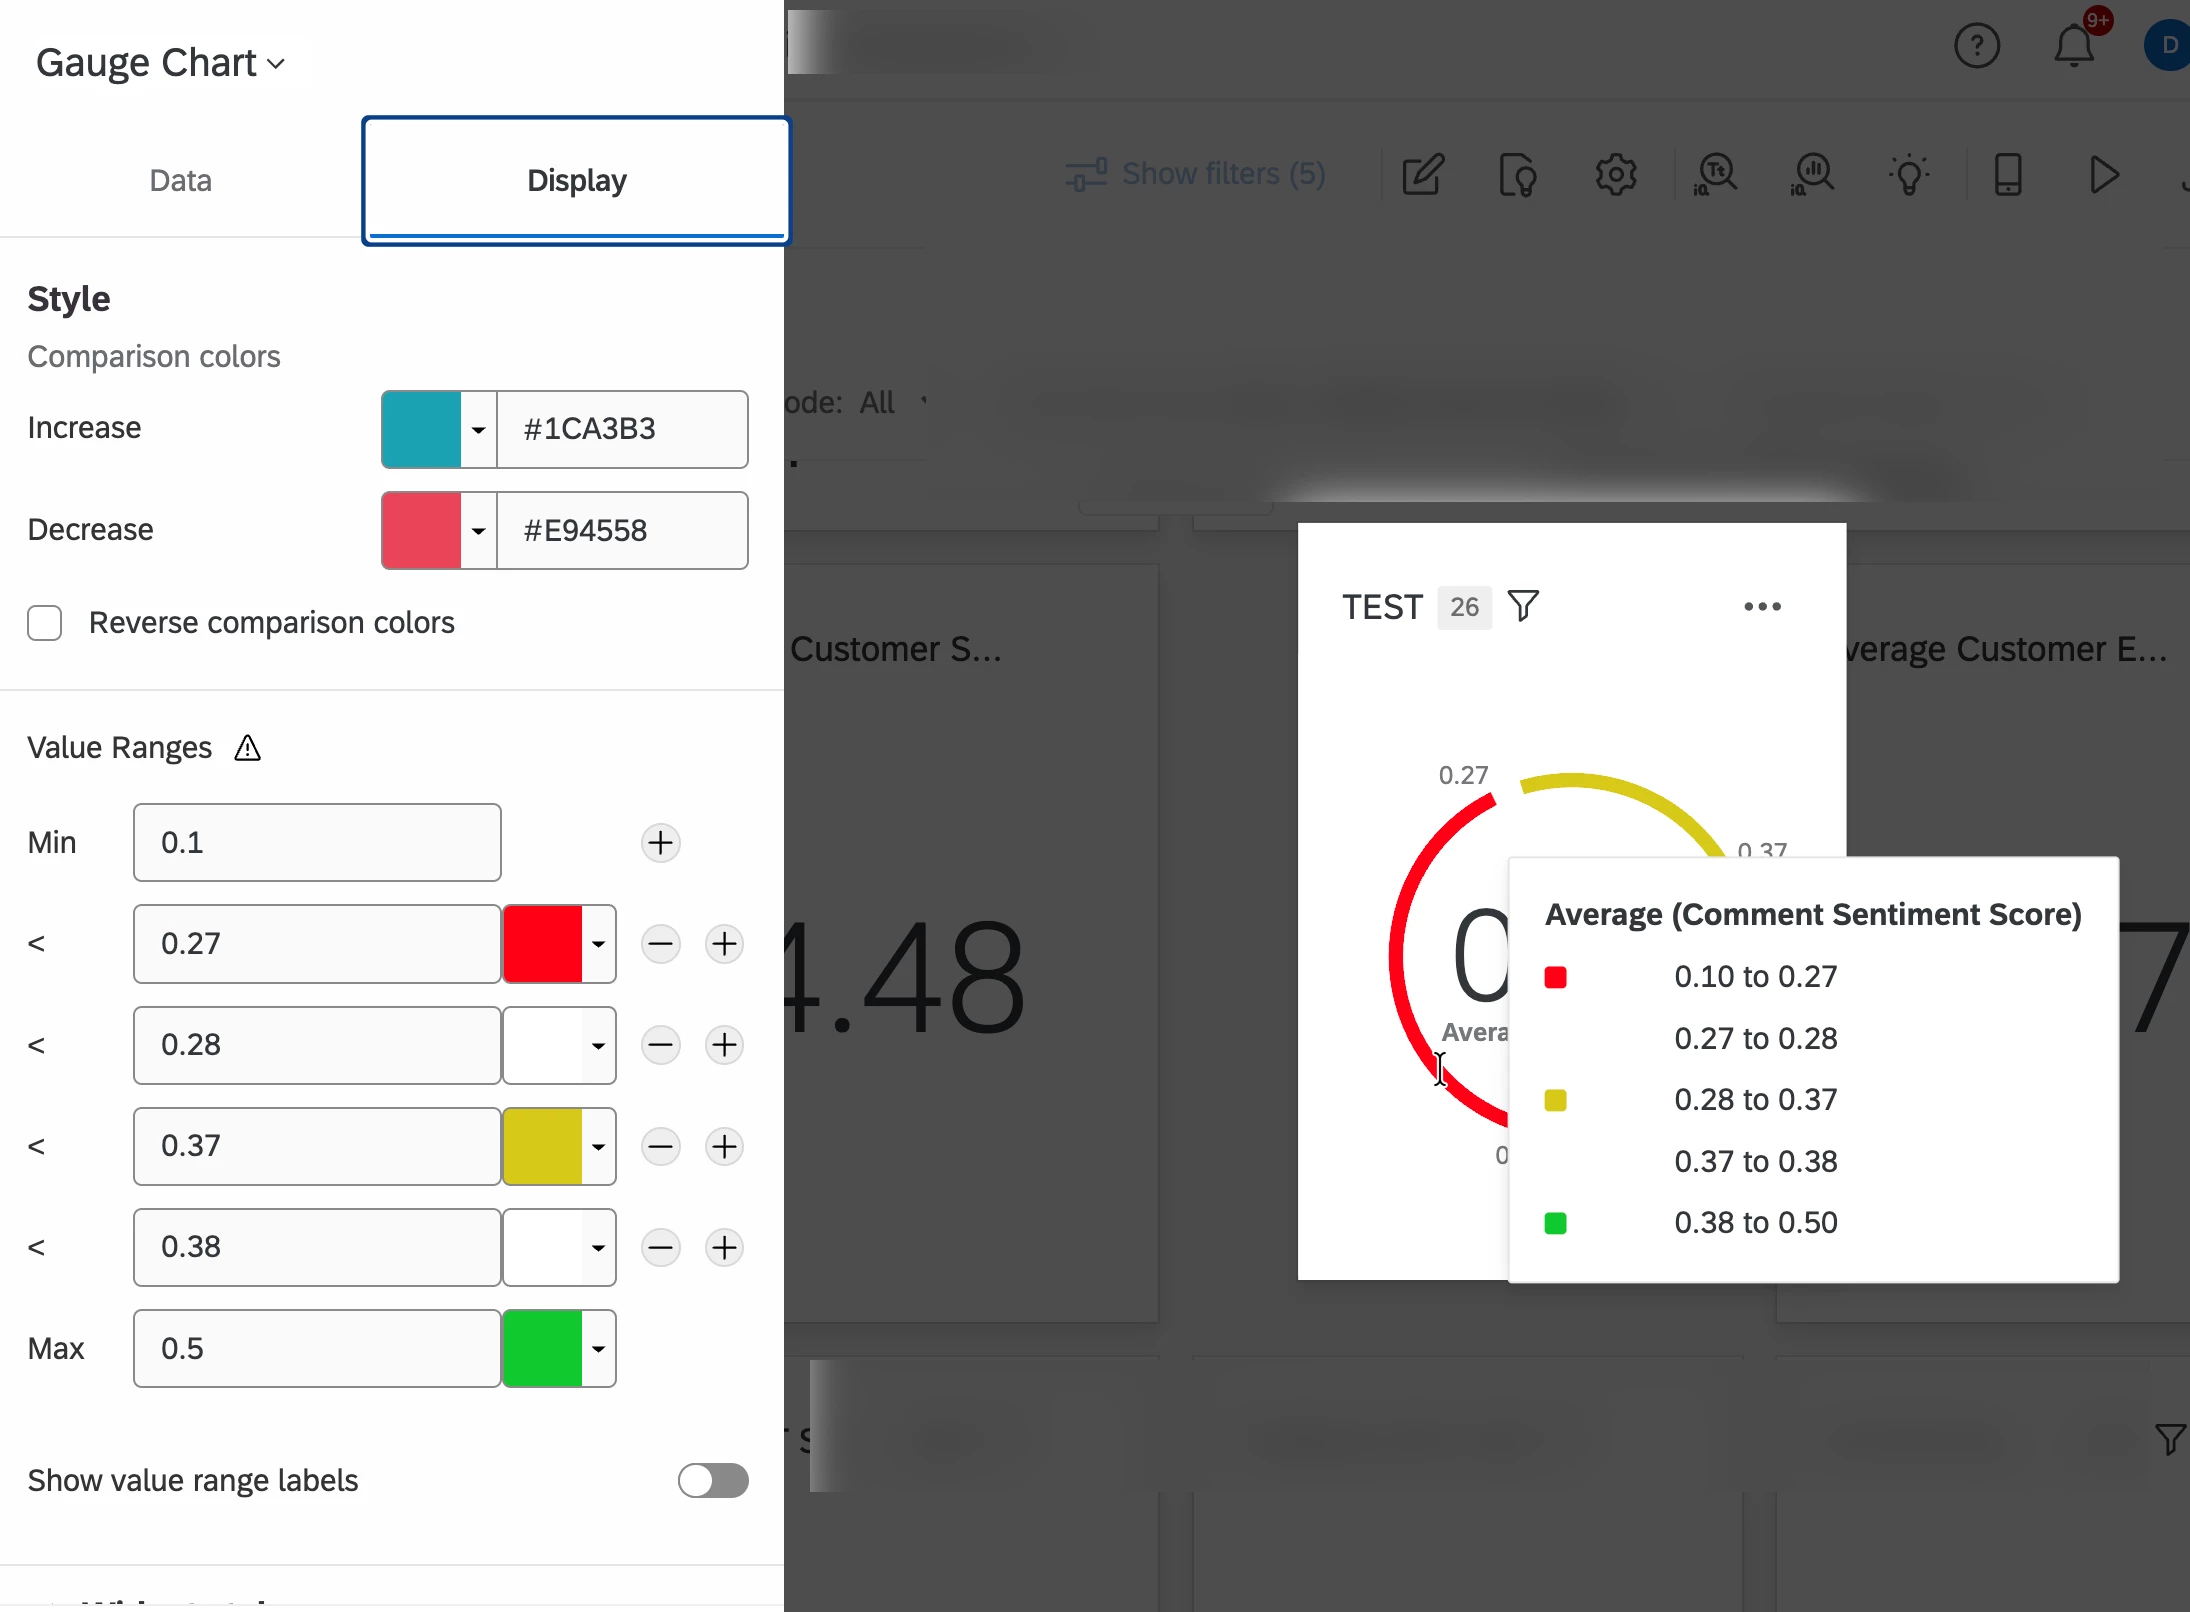
In a gauge chart, i want to set colour showing 1 to 2.7 as red, 2.8 to 3.7 as yellow,3.8 to 5 as green.

The challenge is in display it lets you give min, max and < values. And that value is used to set the upper limit of red and lower limit of yellow, etc.

Can we do anything so that we get the values as desired ?

1 reply

UXDana
Level 2 ●●
Forum|alt.badge.img+4
  • Level 2 ●●
  • November 21, 2025

@Neha Tank This may not be as clean but you could add values between and use white as the color for those (between 2.7 and 2.8). See attached example. I didn’t have data to match so my decimal points are in a different spot than your example you provided.