Hi everyone,
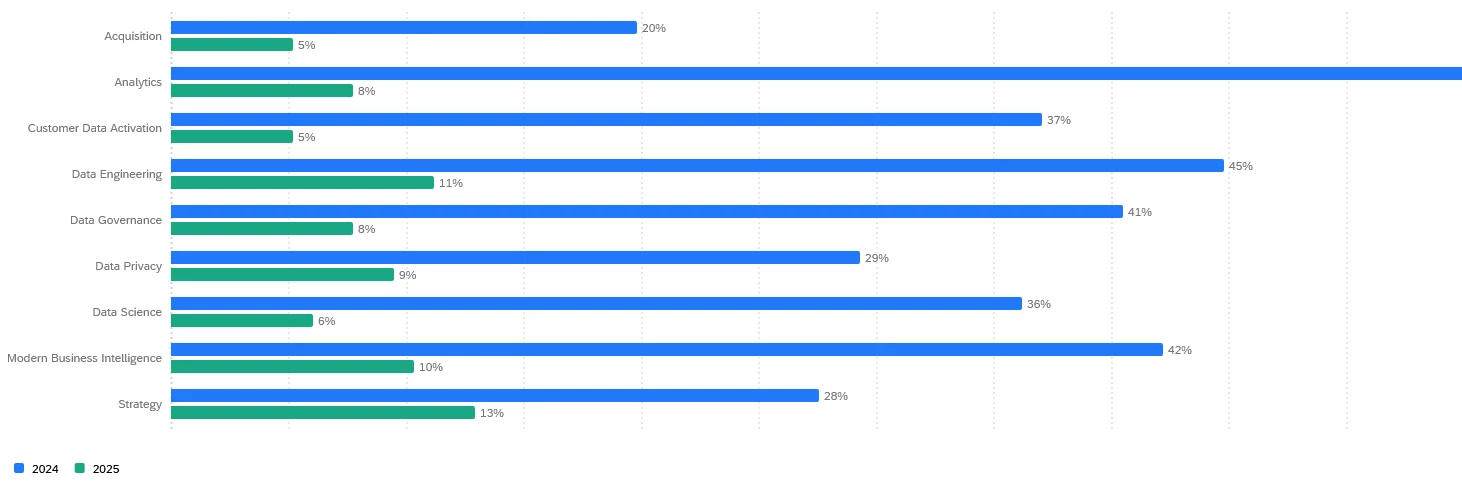
I’m trying to achieve a graph where the total % per year is 100%. Any “show metric as” does not work,
I’ve also asked the Support and apparently it’s not possible, any workaround?
Thanks in advance,
Gabriele

 +1
+1Hi everyone,
I’m trying to achieve a graph where the total % per year is 100%. Any “show metric as” does not work,
I’ve also asked the Support and apparently it’s not possible, any workaround?
Thanks in advance,
Gabriele
Already have an account? Login

Welcome! To join the Qualtrics Experience Community, log in with your existing Qualtrics credentials below.
Confirm your username, share a bit about yourself, then you're ready to explore and connect .
Free trial account? No problem. Log in with your trial credentials to join. No free trial account? No problem! Register here
Already a member? Hi and welcome back! We're glad you're here 🙂
You will see the Qualtrics login page briefly before being taken to the Experience Community.
No account yet? Create an account
Welcome! To join the Qualtrics Experience Community, log in with your existing Qualtrics credentials below.
Confirm your username, share a bit about yourself, then you're ready to explore and connect .
Free trial account? No problem. Log in with your trial credentials to join. No free trial account? No problem! Register here
Already a member? Hi and welcome back! We're glad you're here 🙂
You will see the Qualtrics login page briefly before being taken to the Experience Community.
Enter your E-mail address. We'll send you an e-mail with instructions to reset your password.
