Hello everyone,
I have a question and maybe you have had the same challenge before.
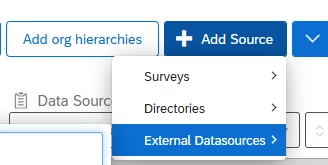
I would like to create one or more graphs with data that is not contained in the Qualtrics data set.
These values are not collected via a study in Qualtrics but by an agency and we get a PowerPoint report.
I would now like to display the most important KPIs from the last few years (X= years; Y= values) in a graph in the dashboard.
So far I have had no luck with the data presentation - I would be happy to receive advice.
Kind regads
Steffen


