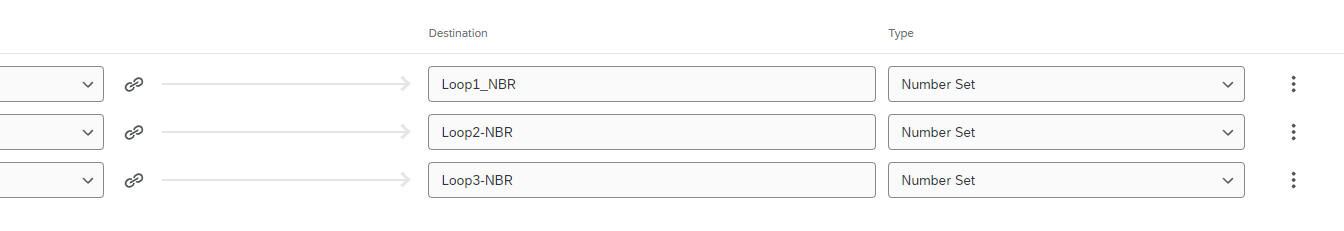
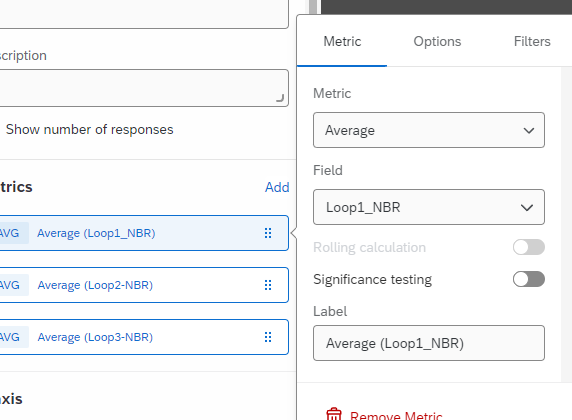
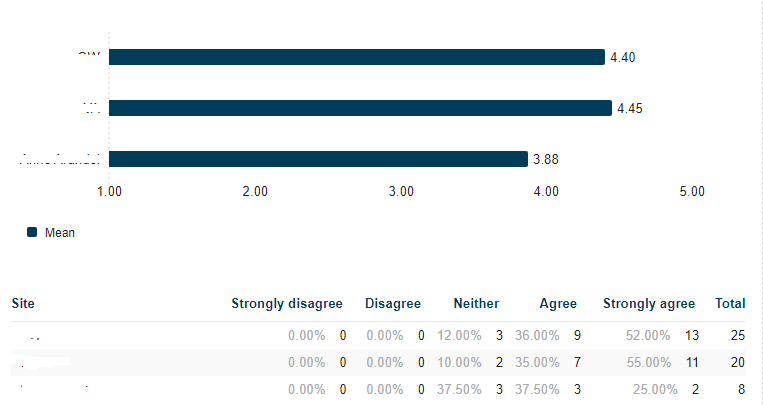
We have a survey that asks a few of the same questions, same response choices but for multiple sites. This is set up using loop and merge. I would like to display this data using Results (stacked bar chart or even simple data table) showing data by site in the one visualization instead of creating separate ones for each site. In Reports you can do this using means or simple data table (see below) but I cannot figure out the setup for this in Results. Any ideas or suggestions??
Thank you, Stephanie