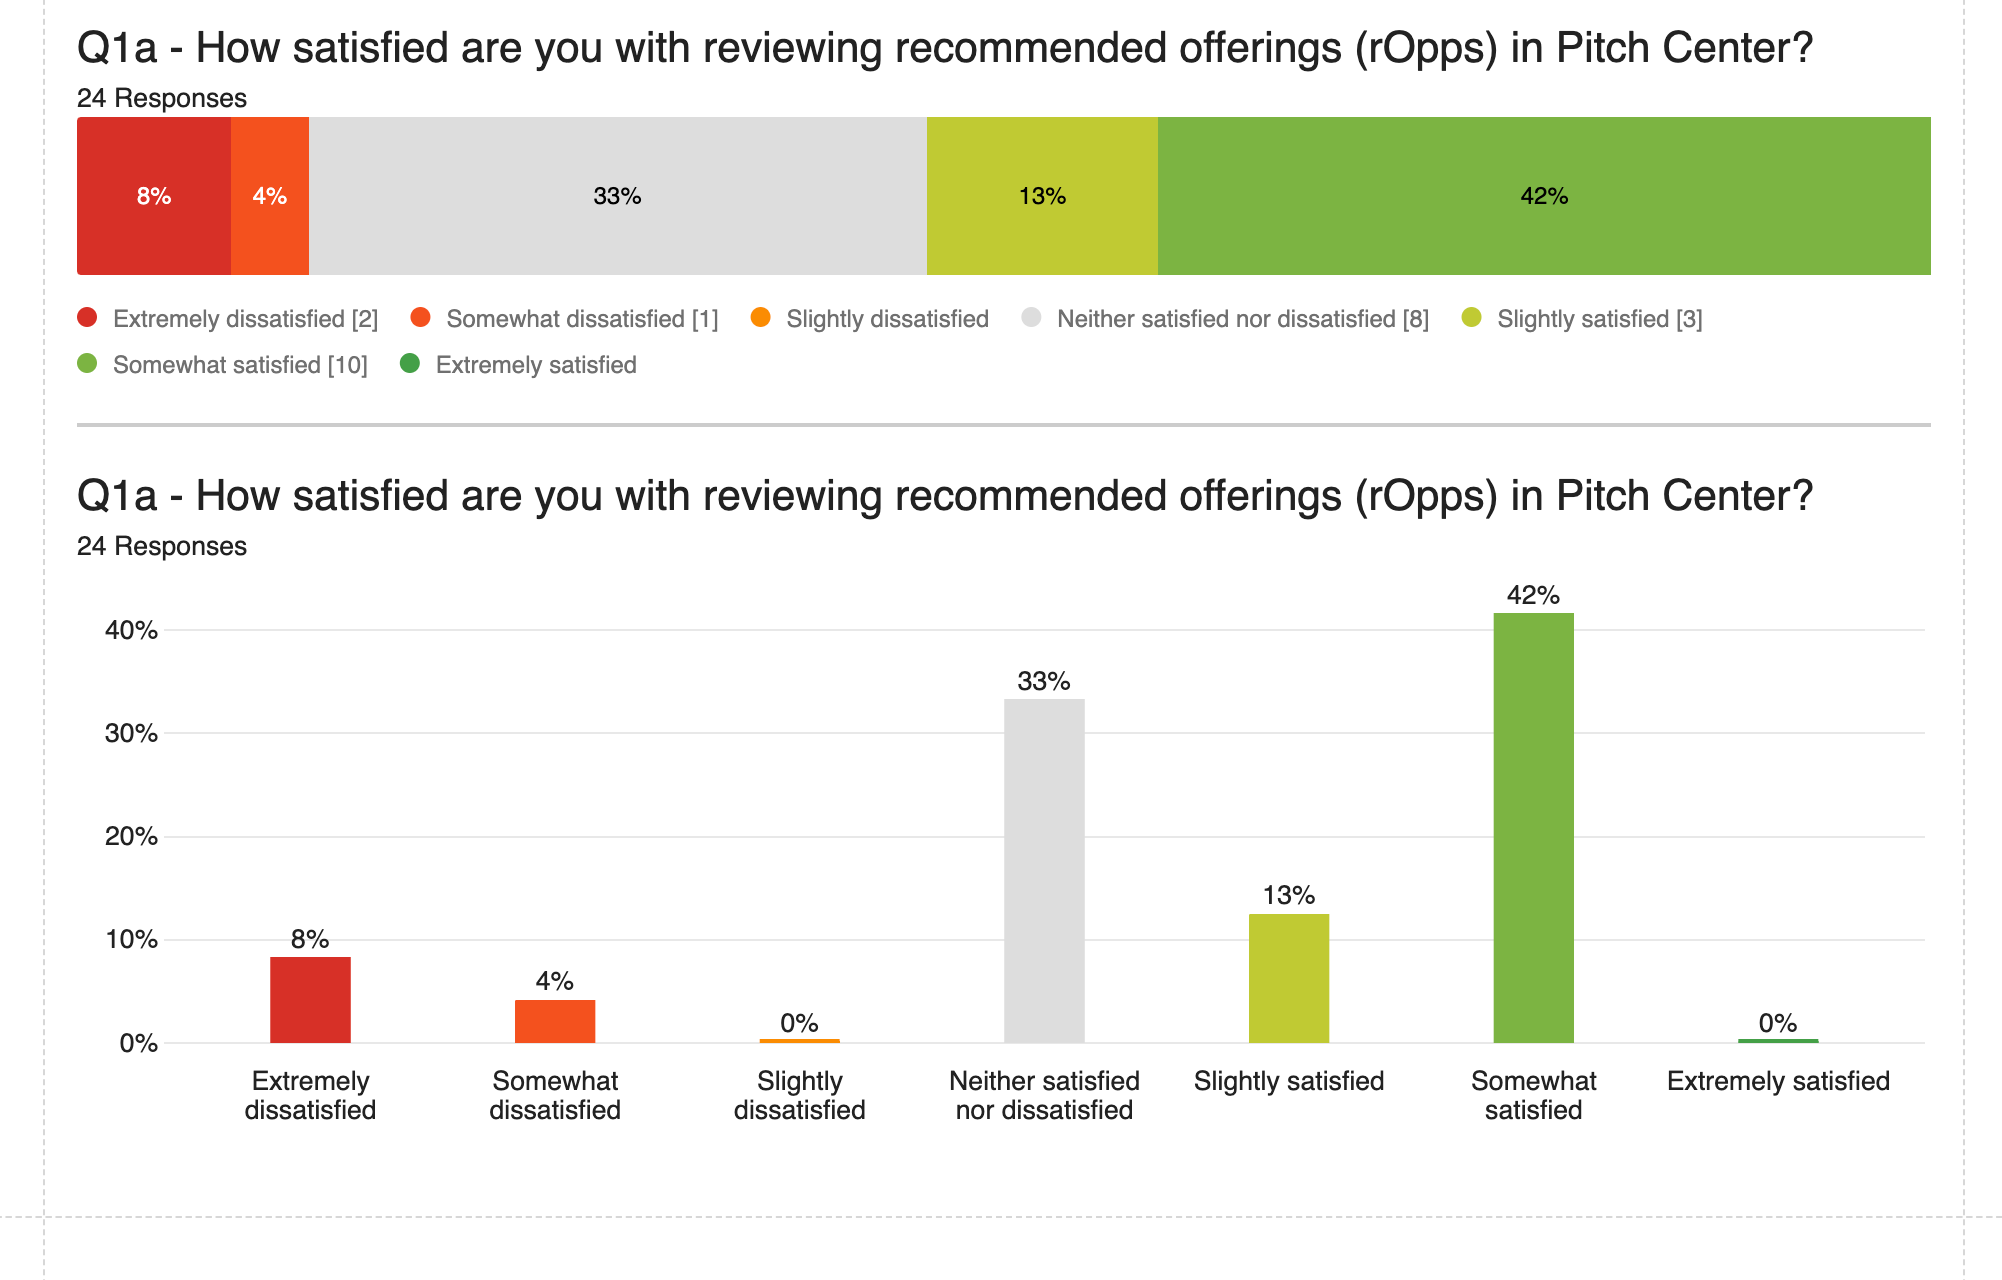
I have a 5-point Likert Scale (Strongly Disagree-Strongly Agree). None of my respondents selected the second point on the scale (disagree) and so the "simple table" and bar graphs are only showing 1-Strongly Disagree, 3-Neutral, 4-Agree, 5-Strongly Agree because there were respondents who selected some of those options. However, I need to be able to also show that 0 or 0% selected 2 (i.e. disagree) as a meaningful data-point. I reached out to support and they only confirmed that I have zero responses for the "Disagree" rating and that's why it's not displaying in the visualizations. They haven't given me a solution to fix it so that I can show that 0% disagree with a given topic.
Please help!
The simple tables visualizations are not showing any of the options with zero respones
Sign up
Already have an account? Login

Welcome! To join the Qualtrics Experience Community, log in with your existing Qualtrics credentials below.
Confirm your username, share a bit about yourself, Once your account has been approved by our admins then you're ready to explore and connect .
Free trial account? No problem. Log in with your trial credentials to join.
No free trial account? No problem! Register here
Already a member? Hi and welcome back! We're glad you're here 🙂
You will see the Qualtrics login page briefly before being taken to the Experience Community
Login with Qualtrics

Welcome! To join the Qualtrics Experience Community, log in with your existing Qualtrics credentials below.
Confirm your username, share a bit about yourself, Once your account has been approved by our admins then you're ready to explore and connect .
Free trial account? No problem. Log in with your trial credentials to join. No free trial account? No problem! Register here
Already a member? Hi and welcome back! We're glad you're here 🙂
You will see the Qualtrics login page briefly before being taken to the Experience Community
Login to the Community

Welcome! To join the Qualtrics Experience Community, log in with your existing Qualtrics credentials below.
Confirm your username, share a bit about yourself, Once your account has been approved by our admins then you're ready to explore and connect .
Free trial account? No problem. Log in with your trial credentials to join.
No free trial account? No problem! Register here
Already a member? Hi and welcome back! We're glad you're here 🙂
You will see the Qualtrics login page briefly before being taken to the Experience Community
Login with Qualtrics

Welcome! To join the Qualtrics Experience Community, log in with your existing Qualtrics credentials below.
Confirm your username, share a bit about yourself, Once your account has been approved by our admins then you're ready to explore and connect .
Free trial account? No problem. Log in with your trial credentials to join. No free trial account? No problem! Register here
Already a member? Hi and welcome back! We're glad you're here 🙂
You will see the Qualtrics login page briefly before being taken to the Experience Community
Enter your E-mail address. We'll send you an e-mail with instructions to reset your password.


