Year to month rolling NPS | XM Community
Question

Year to month rolling NPS


Badge +1

Hi

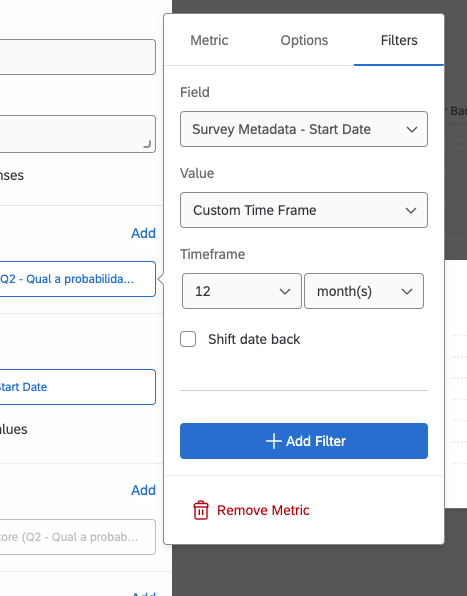
I’m trying to build a widget where I could see for each month, what is the NPS of the last 12 months. Meaning, on the column or bar Jan 2024 I would see the NPS from Feb 1st 2023 to Jan 31st 2024, on the one of Feb 2024 I would see NPS from March 1st 2023 to Feb 29th 2024…


I saw that for Rolling calculation “grouping must match the grouping for your date breakout. For example, if your date data is broken out over years, the rolling average will also automatically be set to years.”


Does anyone have an idea on how to achieve this?


6 replies

Userlevel 6
Badge +21

Hello @CarlaRochaIzoPortugal,

I think ‘Line Chart’ will help you to show the Net Promoter Score (NPS) for each month of the year. Try below steps once:

  1. Add a line chart to your dashboard.
  2. Choose Net Promoter Score as the metric and connect it to your NPS question.
  3. Put the date on the horizontal axis and group it by month.
  4. Turn on rolling calculations for a 12-month period.

This will create a line chart that tracks NPS changes over the past year, based on the current date. For example, if you set it to show changes since a week ago and look at it on January 8, it will display changes since January 1. If you check it on January 31, it will show changes since January 24.

Let me know if this helps.


Badge +1

Thanks @Sachin Nandikol I will try this

Badge +1

Hi @Sachin Nandikol Where do I set up the rolling calculations 12-month period? In Filters? 


Like this?

Userlevel 6
Badge +21

Hello @CarlaRochaIzoPortugal

Please try the following step:

Add Metric → Click on Count → Rolling Metrics → Rolling window (Group by Year)

Badge +1

Thanks @Sachin Nandikol, but the problem there is that I cannot use a different time window in Rolling (year) and in the X axis (month) - I’d tried that before.

Userlevel 6
Badge +21

Try it in filters once.

Leave a Reply