Graphical presentation of results | XM Community
Skip to main content

Hi,

I need help to know how that how can I present the results in graphical form. My question type is ‘Slider’. Is it possible that data can be displayed in graphical form automatically after completion of survey? How to generate graphs from the data on Qualtrics? Please guide asap. 

You can click the “Results” tab within your survey project and a default report should be automatically created for each survey project that shows answers for each question in graphs or tables.


If you click the share button in the default report tab, there’s an option for “manage public report.” This will allow you to get a public link to the default report. You could put that link after the submission in the thank you submission screen area, so users can access the results that update in real-time.


Hi, 

In the results tab data is presented in table form. I want it in bar charts. How to do that?


@Sahar Yameen You can click on the table in the results tab that you are hoping to change, and there will be a panel that appears on the right. In the panel, under where it says “visualization,” there will be different pictures or icons of graphical types and you can pick the second option to change it to a bar chart.


Thank you. But clicking the ‘report’ tab, it says there is no report of this survey.


Hi @Sahar Yameen , If you are asking to show graphs for the respondent on the fly i.e. as soon as they have responded to survey then we can do this using JS as seen here.


Thank you. But clicking the ‘report’ tab, it says there is no report of this survey.

@Sahar Yameen 

  1. Go to report tab
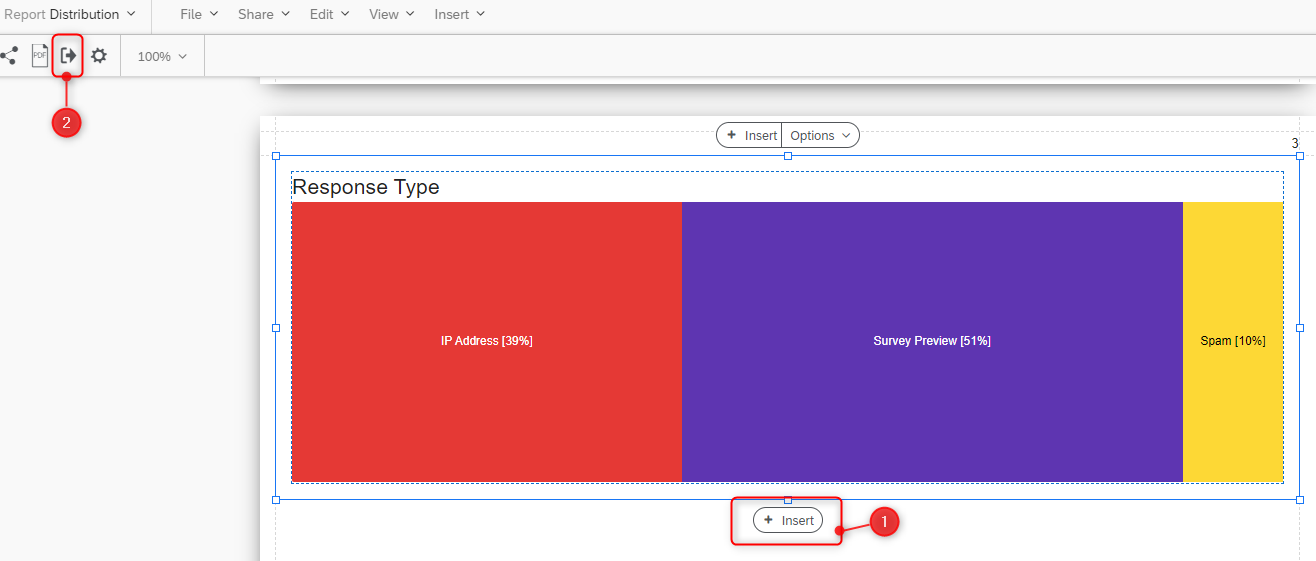
  1. Create New Report - Insert what you want to build and create a public report, you can watch the result with that link


https://www.qualtrics.com/support/survey-platform/reports-module/results-section/reports-overview/ 

This article gives a good overview of how to use the results or report tabs.


Hi,

If a survey is based on for example 30 Questions. Is it possible that we get live results and graph on each answers of a question before completing all the 30 Questions?


Hi,

If a survey is based on for example 30 Questions. Is it possible that we get live results and graph on each answers of a question before completing all the 30 Questions?

@Sahar Yameen You cannot see the results for incomplete responses within the report tab.


@Sahar Yameen The only way to see incomplete responses is within the data and analysis tab under the “responses in progress tab.” However, there will not be graphical representations there.

Information about responses in progress here: https://www.qualtrics.com/support/survey-platform/data-and-analysis-module/data/responses-in-progress/


Leave a Reply