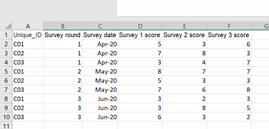
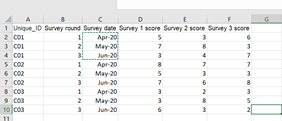
Hi all. I have had longitudinal surveys completed with survey responses having been entered in Excel. I want to upload the data so that I can use Qualtrics to analyse it. Can anyone advise me on the correct formatting to use in the spreadsheet so that Qualtrics will work out that there are multiple responses to the same survey by the same person? I'm wanting to examine individual changes and also group changes in responses.
For example (this is an example only and not my actual scenario/data): I have 3 respondents. Each respondent completes 3 surveys on 3 different occasions. Each respondent has a unique identifier that is used across all 3 of their survey completions.
The questions I have are:
- Should I put my data headings across columns or down a row for: Unique_ID, Survey round, Survey date, Survey 1 score, Survey 2 score, Survey 3 score?
- Should I have every respondent's data for each individual round grouped together in consecutive rows/columns, or should I have one respondent's data for all three time periods together, followed by the subsequent respondents...or does this not matter as the data headings should overcome this?
- If I use one of the following formats (in the examples below) and save the file as a csv file, will this work in Qualtrics for longitudinal analysis, or is there a totally different format/structure you would recommend to achieve this?
I'm putting in some images to highlight what I mean with the across columns/down rows.
Example 1:
 Example 2:
  Example 3:
  Example 4:
  Thanks for the use of your brain...hoping someone knows how to do this!!


