Dear all,
I'm seeking to correlate different key drivers to a NPS.
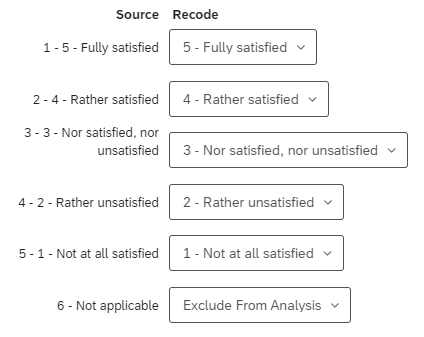
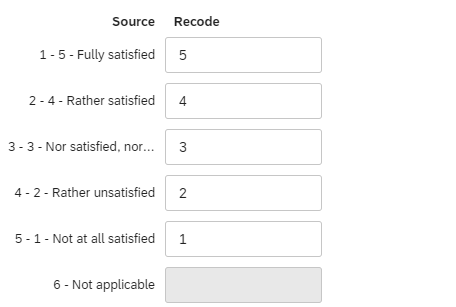
The key drivers exist both in text set (not satisfied to fully satisfied) and in number set (1 for not satisfied and 5 for fully satisfied).
When I use regression analysis from StatsIQ with the NPS as the key variable, the results are different depending if I correlate to the text set or the number set. If I do the correlation using text set drivers, let's say that drivers #1 and #2 will be the most correlated to the NPS. But if I do the correlation using number set drivers, drivers #3 and #4 will be the most correlated to the NPS.
Thus, I'm not too sure which analysis is the one I should rely on to draw conclusions.
Have you already faced this question? Would you be able to share some insights on how to interpret the results?
Many thanks in advance.
FJ

StatsIQ - Different correlation results if I use text set or number set
Best answer by AmaraW
Hi FJO! If you haven’t already, we’d recommend reviewing the Q-Tip on this support page about Regressions to help you get started. If you still have questions after reviewing the linked support page, you'll want to reach out to the Support team, as they are best equipped to help answer questions and provide support! 😁


Sign up
Already have an account? Login

Welcome! To join the Qualtrics Experience Community, log in with your existing Qualtrics credentials below.
Confirm your username, share a bit about yourself, then you're ready to explore and connect .
Free trial account? No problem. Log in with your trial credentials to join.
No free trial account? No problem! Register here
Already a member? Hi and welcome back! We're glad you're here 🙂
You will see the Qualtrics login page briefly before being taken to the Experience Community.
Login with Qualtrics
Welcome! To join the Qualtrics Experience Community, log in with your existing Qualtrics credentials below.
Confirm your username, share a bit about yourself, then you're ready to explore and connect .
Free trial account? No problem. Log in with your trial credentials to join. No free trial account? No problem! Register here
Already a member? Hi and welcome back! We're glad you're here 🙂
You will see the Qualtrics login page briefly before being taken to the Experience Community.
Login to the Community
No account yet? Create an account
Welcome! To join the Qualtrics Experience Community, log in with your existing Qualtrics credentials below.
Confirm your username, share a bit about yourself, then you're ready to explore and connect .
Free trial account? No problem. Log in with your trial credentials to join.
No free trial account? No problem! Register here
Already a member? Hi and welcome back! We're glad you're here 🙂
You will see the Qualtrics login page briefly before being taken to the Experience Community.
Login with Qualtrics
Welcome! To join the Qualtrics Experience Community, log in with your existing Qualtrics credentials below.
Confirm your username, share a bit about yourself, then you're ready to explore and connect .
Free trial account? No problem. Log in with your trial credentials to join. No free trial account? No problem! Register here
Already a member? Hi and welcome back! We're glad you're here 🙂
You will see the Qualtrics login page briefly before being taken to the Experience Community.
Enter your E-mail address. We'll send you an e-mail with instructions to reset your password.