Changing chart type | XM Community
Skip to main content

While trying to complete one of the Challenges in the training account for the ‘Reporting Survey Results with Results Dashboards’ training module, the screen says to ‘Please enable editing and configure widget.’ I get this message after changing from Table (default) to Donut/Pie. I’m already in edit mode. Is there another place to enable editing? Images attached.
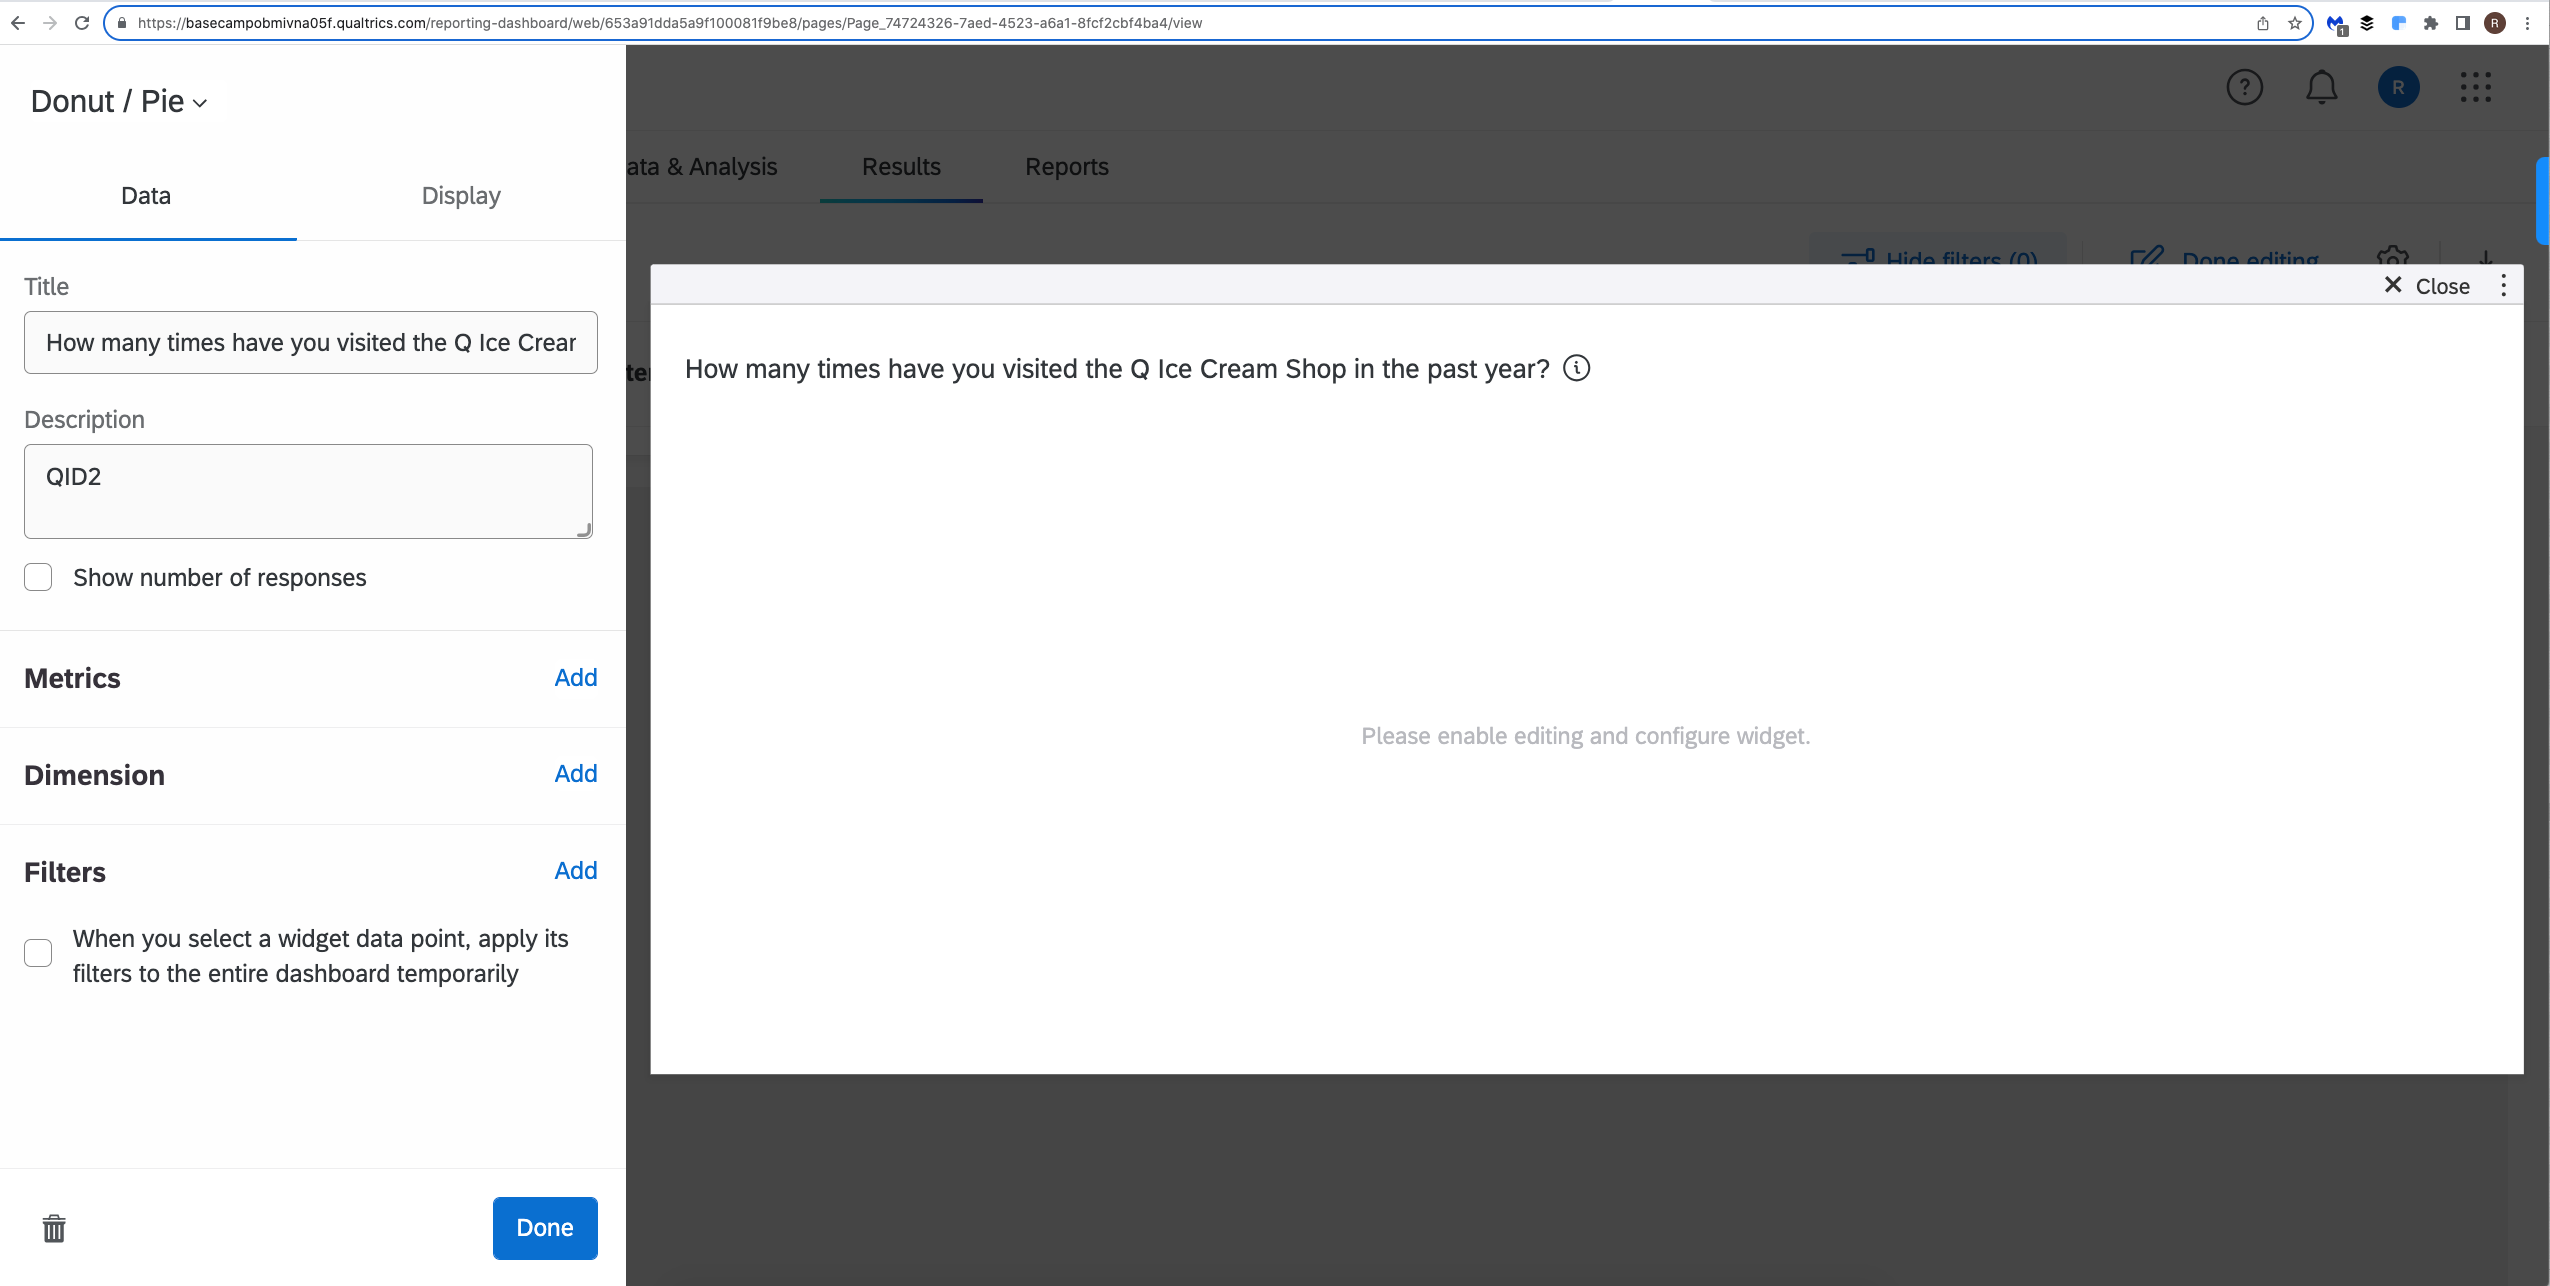
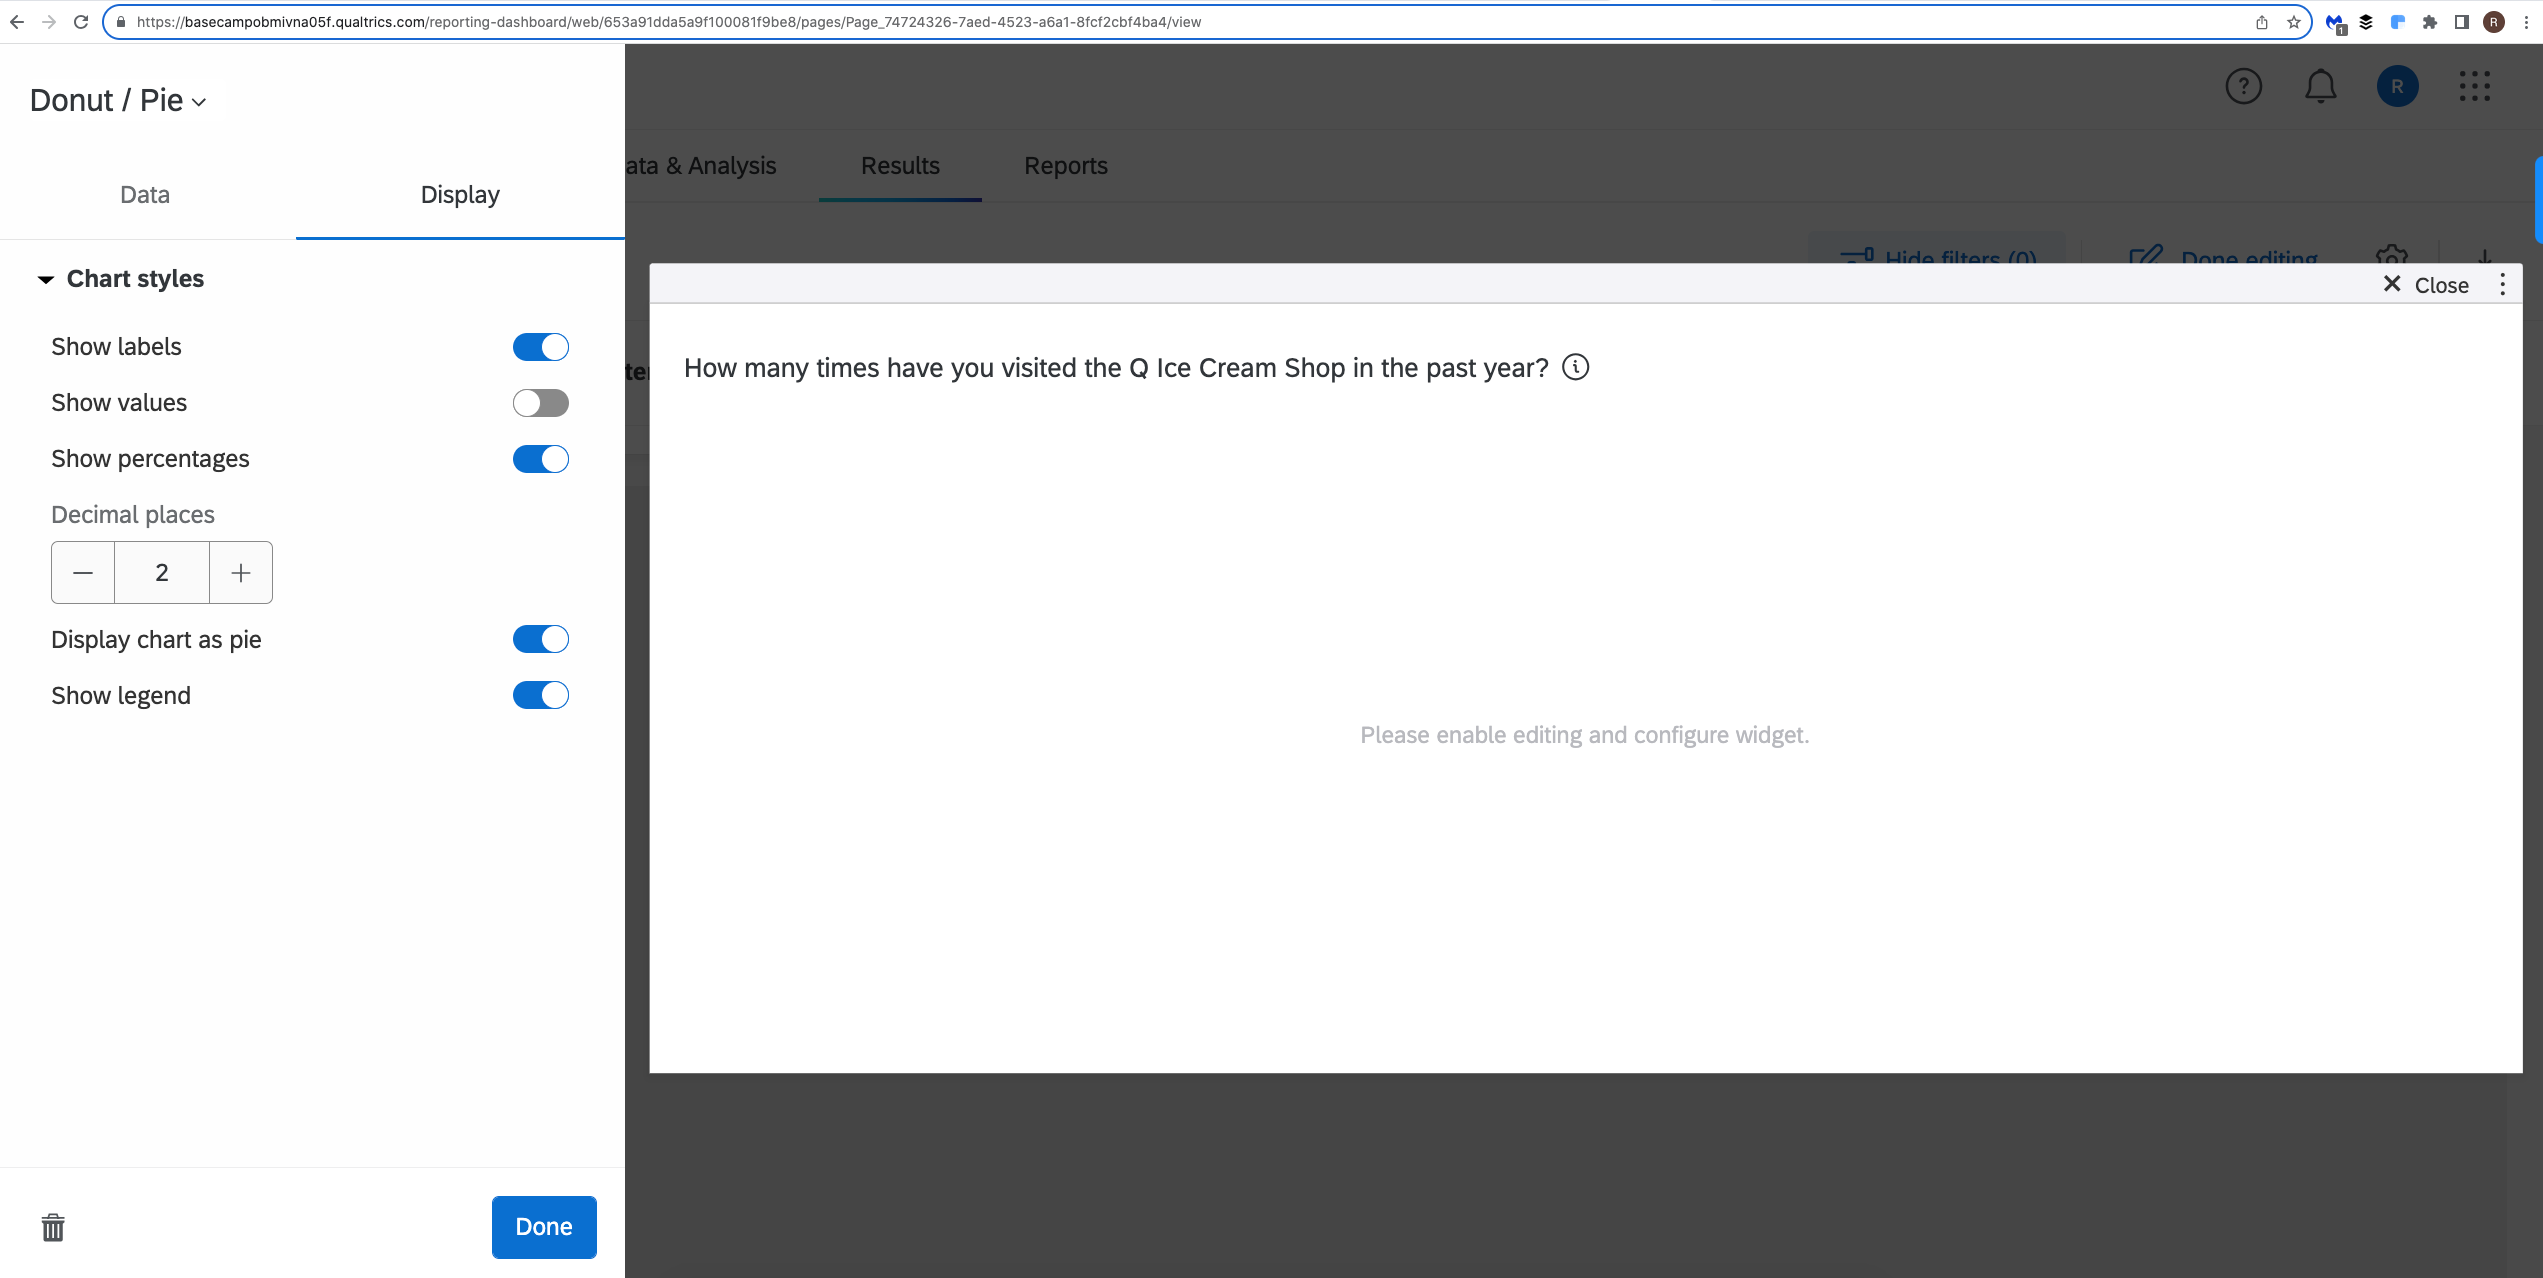
 

After you have configured the widget correctly, I believe that message should go away. If not, I’d try exiting out and going back into the dashboard to see if it fixes.


I believe I configured the widget correctly. The training instructions say to:

  • Change Q2 into a donut/pie chart widget that shows the percentage of people who selected each choice in Q2. Make sure the legend is displayed at the bottom of the widget under Display Options.

I did that and then clicked DONE. The chart didn’t refresh to the new chart style. I only get that message. I logged out and back in a couple times and it still gives me that message.

.  

@Malschr You can try to add a new pie chart in the dashboard. Switching widget type sometime mess up and wipe off all of your setting anyway, in your case it even show some kind of bug. I know the instructions said change but this kind of challenges is more like a sandbox for you to get used to working with Qualtrics. It’s not only way to get things done.


Leave a Reply