Find percentage of responses above certain threshold | XM Community
Skip to main content

Hello!

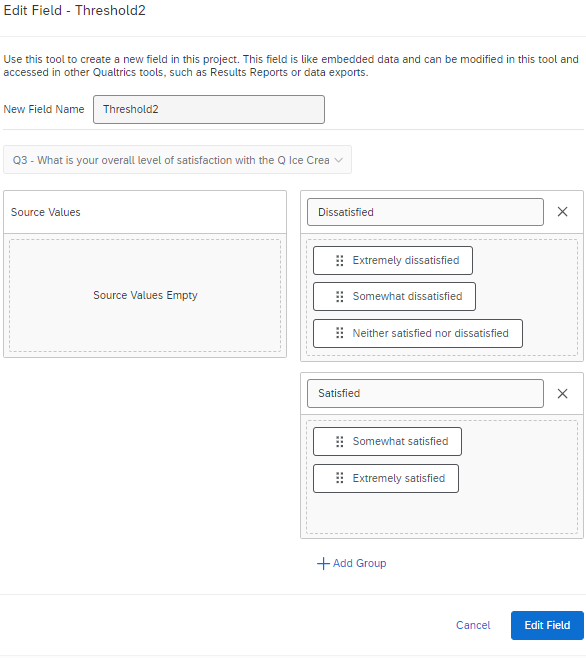
I have a survey with a question set up as seen below:

In a report that I’m creating, I want to be able to see the percentage of responses that were either ‘Somewhat likely’ or ‘Very likely’. I have set up scoring for the question, so that ‘Very unlikely’ = 1 and ‘Very likely’ = 5. As such, I effectively want to view the percentage of responses that were equal to or greater than 4.

I tried to set this up in the Data & Analysis section using a bucket, but it simply uses the text ‘Somewhat likely’ etc. instead of the scoring values that I set up. Is there a way to view the percentage of survey respondents that selected ‘Somewhat/Very likely’ in the report? I need to this value as simple text. Any help would be much appreciated.

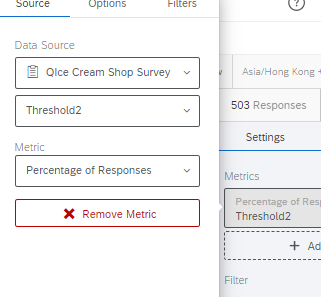
When you bucket it in Data & Analysis, you can change the name of the group.

In the report, change it to percentage. Feel free to adjust the axis values (names) and add data values.


Thank you for your response, Chee. This is a good solution that I will use.

Is there a way to get those values as piped text instead? Ideally, I need the percentage of respondents that are ‘satisfied’ available as piped text, rather than a metric on a graph, so that I can add it as a simple value into a text section.


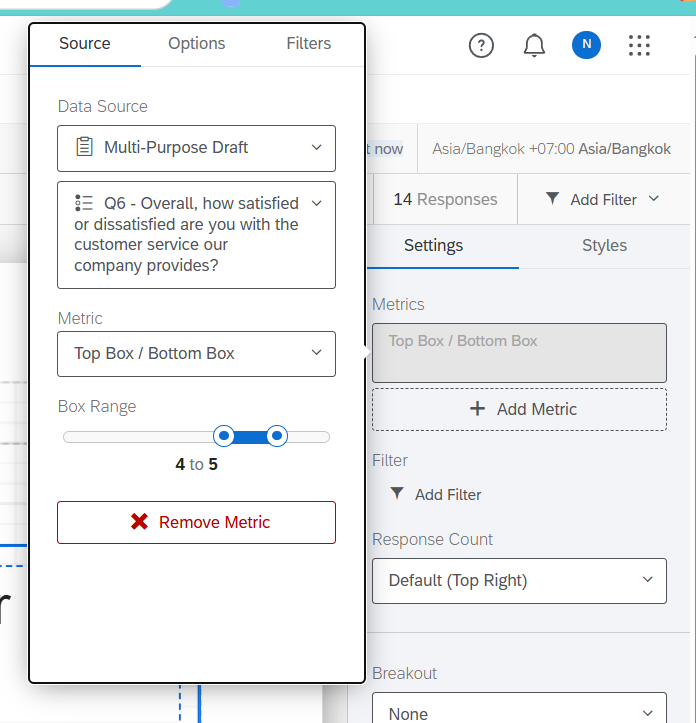
@madeline_b You don’t need to do that much work for that. Scoring is for different purpose. Recode value Recode Values is what you need to assign value and in the report Topbox/Bottom box will get you the percentage of Top2box (That’s how we call it).

Don’t need to make everything from scratch. There’s already solution for you


@Nam Nguyen thanks, I didn’t realise that. Good solution and much simpler.

However, I still would like this value to be available as a simple text value, rather than a value on a graph, so that I can pipe it in to a paragraph of text.


Leave a Reply