Hi there,
I have a survey which for one question has a list of 11 multiple options, where the respondent can select 0 or more.
In the report, I'd like to show a list of how many respondents have selected 0 options, 1 option, 2 options, etc. I'm hoping to see a table something like this, so I could see that 4 respondents didn't select any options, 250 selected 1, etc. 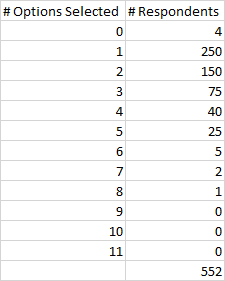 The survey is for feedback, and this is a list of issues that arose, so I'm trying to see how many respondents had 1 issue, 2 issues, etc. Of course, the standard table/graph is showing me how many had issue 1, issue 2, etc, which is also useful, but I want to now look at this from the customer point of view and see how many customers had only 1 issue versus 2/3/4/5 issues each!
I can't find how to display this type of table on a report. I'd appreciate your assistance on this!
Best wishes,
Fintan

Count how many respondents selected multiple responses?
Best answer by fintan
that's perfect, and it worked! thank you!

Sign up
Already have an account? Login

Welcome! To join the Qualtrics Experience Community, log in with your existing Qualtrics credentials below.
Confirm your username, share a bit about yourself, then you're ready to explore and connect .
Free trial account? No problem. Log in with your trial credentials to join.
No free trial account? No problem! Register here
Already a member? Hi and welcome back! We're glad you're here 🙂
You will see the Qualtrics login page briefly before being taken to the Experience Community.
Login with Qualtrics
Welcome! To join the Qualtrics Experience Community, log in with your existing Qualtrics credentials below.
Confirm your username, share a bit about yourself, then you're ready to explore and connect .
Free trial account? No problem. Log in with your trial credentials to join. No free trial account? No problem! Register here
Already a member? Hi and welcome back! We're glad you're here 🙂
You will see the Qualtrics login page briefly before being taken to the Experience Community.
Login to the Community
No account yet? Create an account
Welcome! To join the Qualtrics Experience Community, log in with your existing Qualtrics credentials below.
Confirm your username, share a bit about yourself, then you're ready to explore and connect .
Free trial account? No problem. Log in with your trial credentials to join.
No free trial account? No problem! Register here
Already a member? Hi and welcome back! We're glad you're here 🙂
You will see the Qualtrics login page briefly before being taken to the Experience Community.
Login with Qualtrics
Welcome! To join the Qualtrics Experience Community, log in with your existing Qualtrics credentials below.
Confirm your username, share a bit about yourself, then you're ready to explore and connect .
Free trial account? No problem. Log in with your trial credentials to join. No free trial account? No problem! Register here
Already a member? Hi and welcome back! We're glad you're here 🙂
You will see the Qualtrics login page briefly before being taken to the Experience Community.
Enter your E-mail address. We'll send you an e-mail with instructions to reset your password.