

Hi, I am trying to take the survey results, aggregate the information, then share it back to the person taking the survey. I was able to create the following code which does just that. However, rather than have a button that the user has to push in order to sort the table, I want the table to auto sort, and only present the top 3 choices. I would also like to take this information and present it as a bar graph. I have tried using the onload function, but it does not work for me. So far, my code works to create a table that the user clicks a button to sort. Here is the code and an image of table.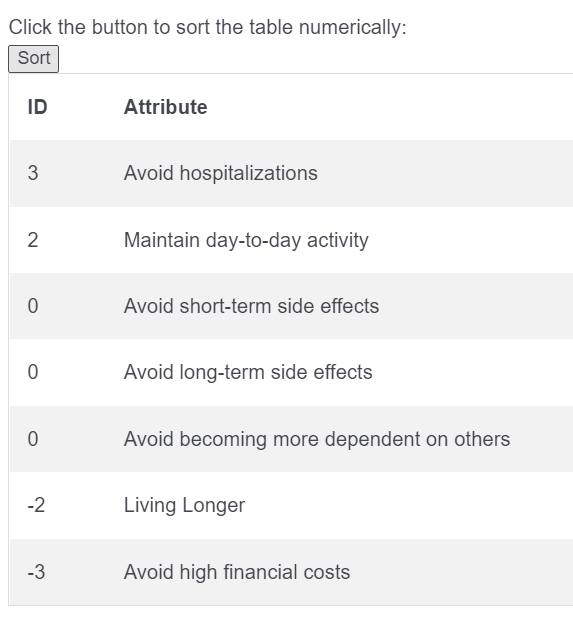 Any help with getting this to auto sort and display a bar graph would be greatly appreciated.
Click the button to sort the table numerically:
| ID | Attribute |
|---|---|
| $e{ q://QID2/SelectedAnswerRecode/3 + q://QID4/SelectedAnswerRecode/2 + q://QID12/SelectedAnswerRecode/4 + q://QID11/SelectedAnswerRecode/1 } | Living Longer |
| $e{ q://QID1/SelectedAnswerRecode/1 + q://QID4/SelectedAnswerRecode/3 + q://QID10/SelectedAnswerRecode/4 + q://QID11/SelectedAnswerRecode/2 } | Maintain day-to-day activity |
| $e{ q://QID9/SelectedAnswerRecode/4 + q://QID12/SelectedAnswerRecode/2 + q://QID11/SelectedAnswerRecode/3 } | Avoid short-term side effects |
| $e{ q://QID1/SelectedAnswerRecode/4 + q://QID4/SelectedAnswerRecode/1 + q://QID9/SelectedAnswerRecode/2 + q://QID12/SelectedAnswerRecode/3 } | Avoid long-term side effects |
| $e{ q://QID1/SelectedAnswerRecode/3 + q://QID2/SelectedAnswerRecode/2 + q://QID9/SelectedAnswerRecode/1 + q://QID11/SelectedAnswerRecode/4 } | Avoid high financial costs |
| $e{ q://QID1/SelectedAnswerRecode/2 + q://QID2/SelectedAnswerRecode/4 + q://QID10/SelectedAnswerRecode/3 + q://QID12/SelectedAnswerRecode/1 } | Avoid becoming more dependent on others |
| $e{ q://QID2/SelectedAnswerRecode/1 + q://QID4/SelectedAnswerRecode/4 + q://QID9/SelectedAnswerRecode/3 + q://QID10/SelectedAnswerRecode/2 } | Avoid hospitalizations |

