Hi everyone,
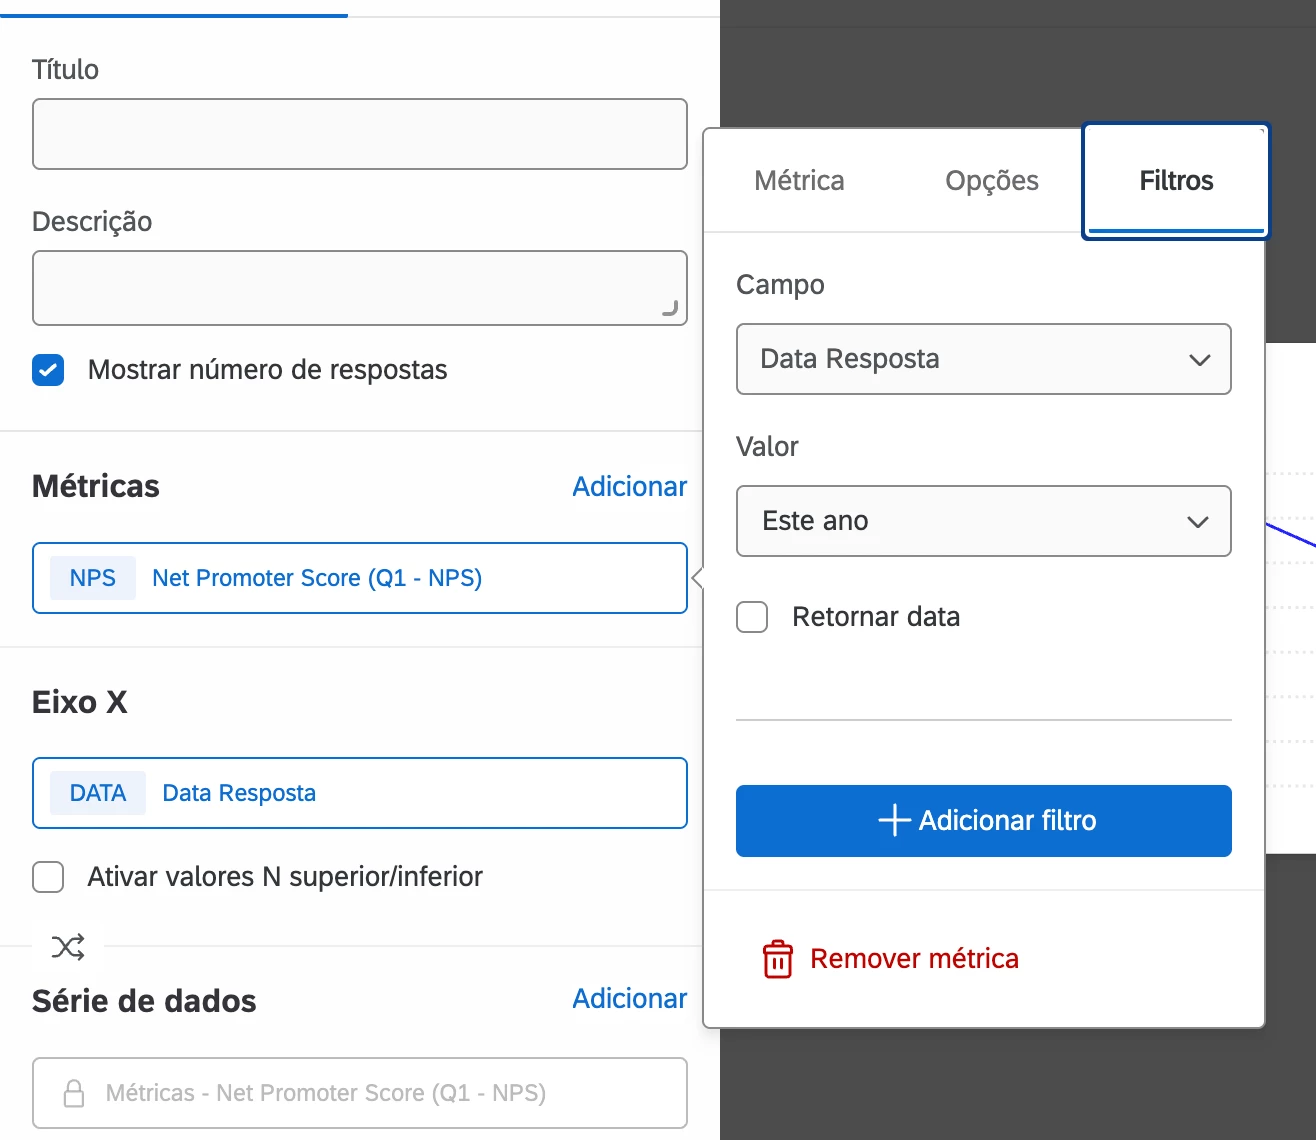
I wanted to ask if it’s possible to configure a line chart in a Qualtrics CX dashboard to show a cumulative NPS for the current year only.
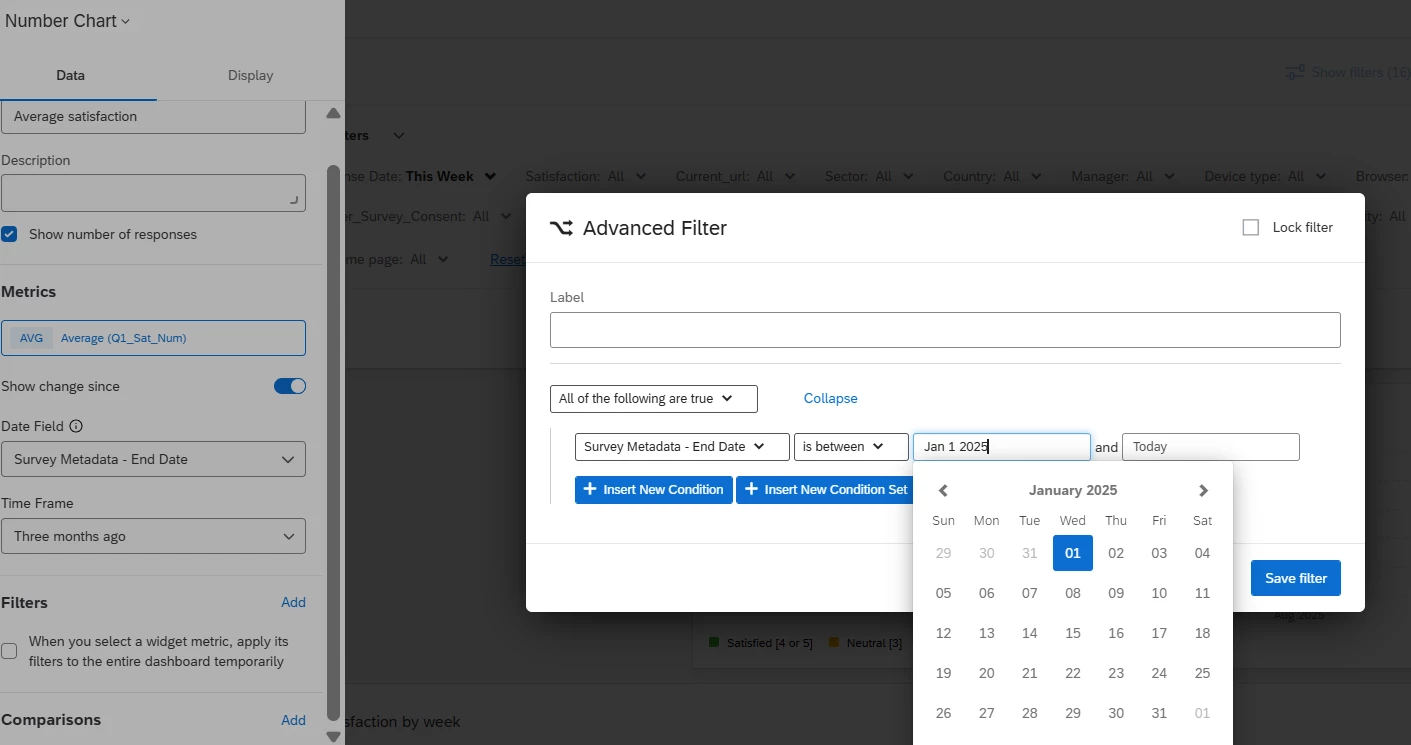
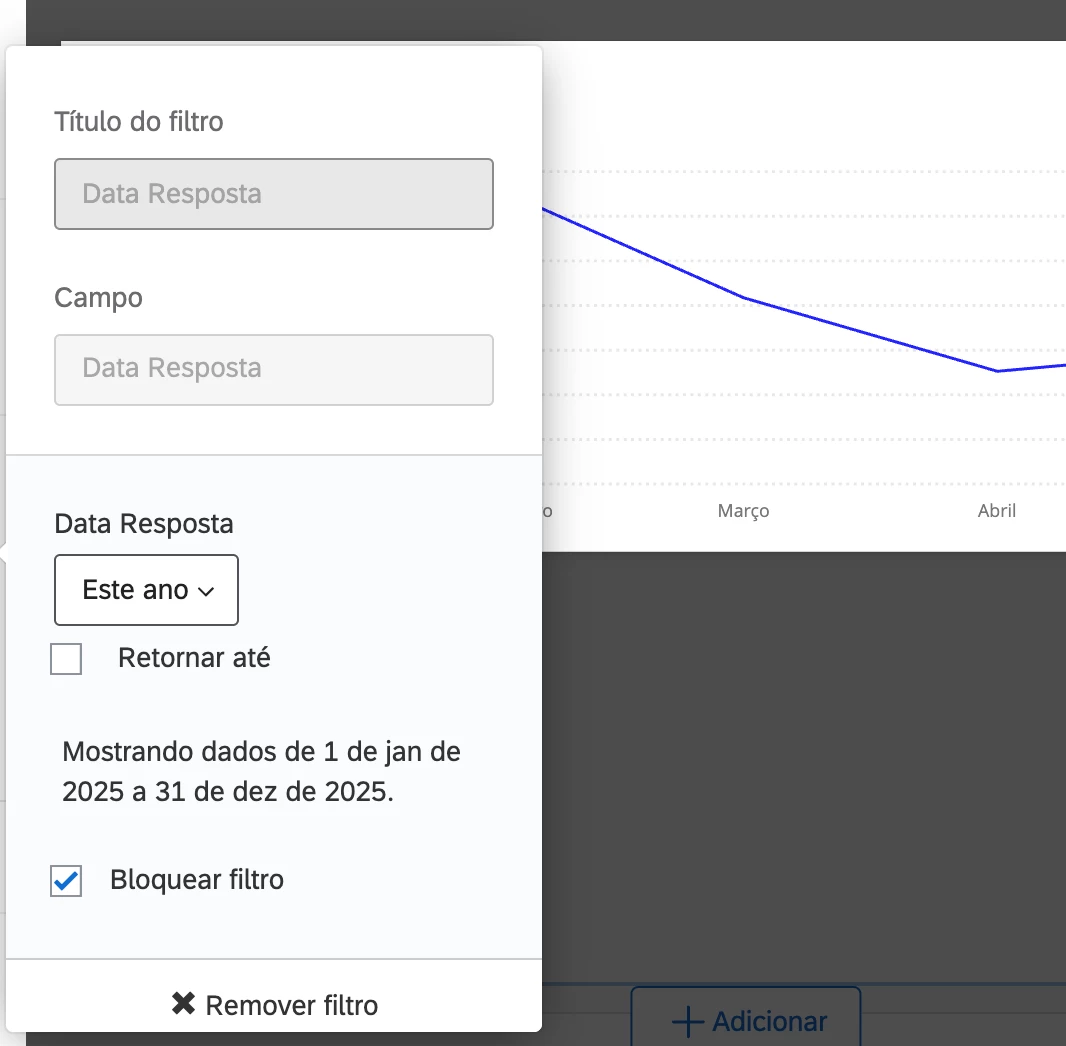
Here’s the situation: I know there’s a continuous metric option in Qualtrics, but the problem is that it always calculates the previous 12 months rolling, regardless of the filters I apply. For example, if I set a filter for “this year only,” the metric in January still shows data from February of the previous year up to January of the current year.
What I need is a chart where:
-
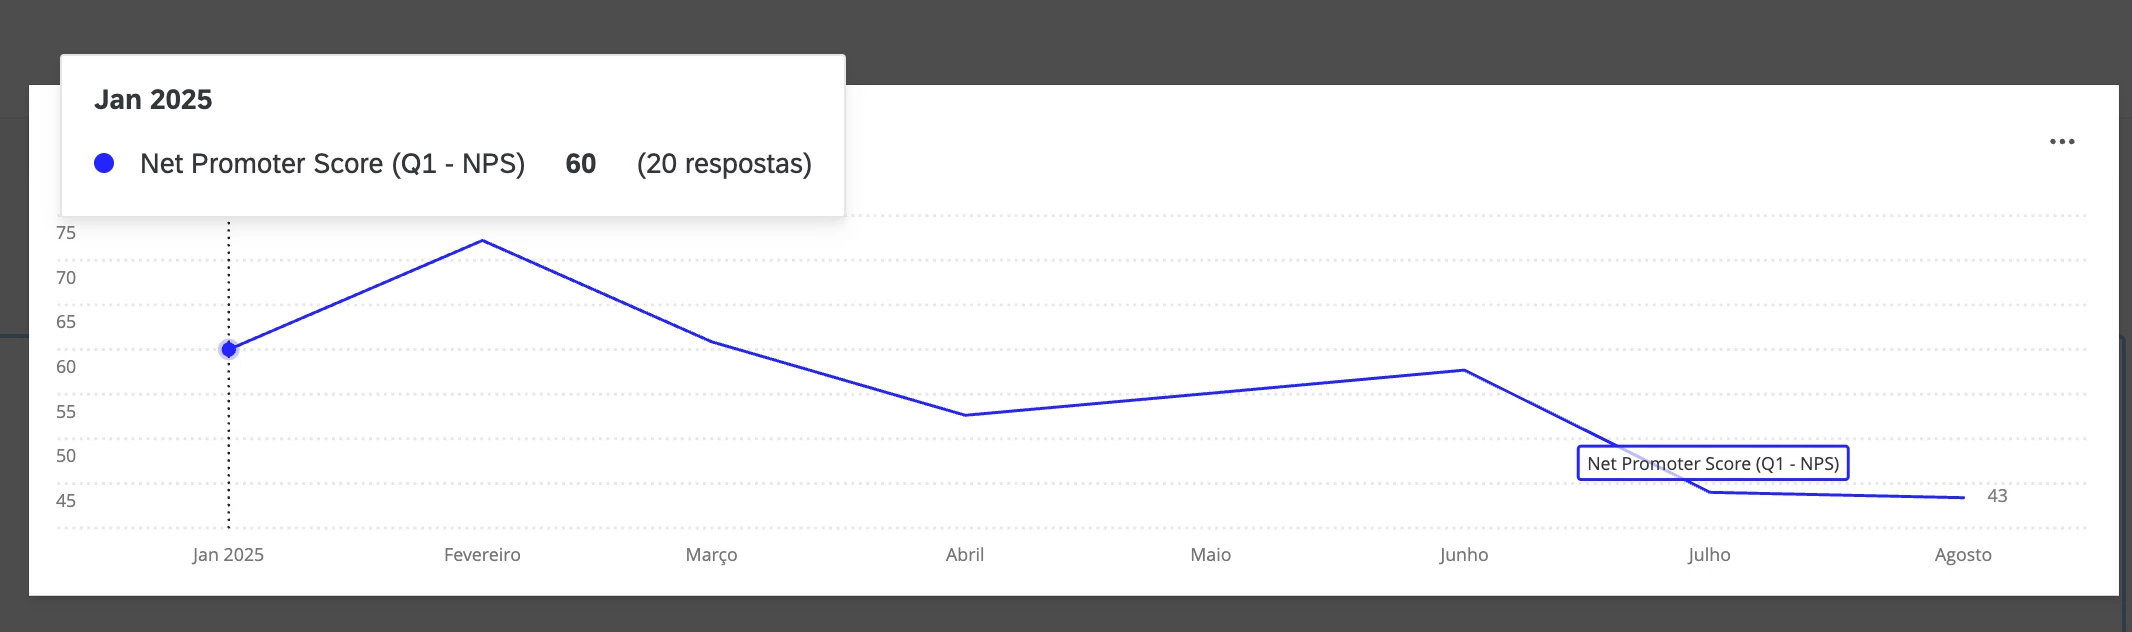
In January, the NPS is calculated only with responses from January of this year.
-
In February, the NPS is recalculated as the cumulative of January + February responses.
-
In March, the cumulative is Jan–Mar, and so on, until December.
Basically, I want a year-to-date cumulative NPS trend line, but restricted to the current year (no data leaking in from the previous year).
Is this possible to achieve within the Qualtrics dashboard settings, or would it require a custom metric/other workaround?
Thanks in advance!