CX dashboard mapping - export mapping | Experience Community
Skip to main content
Solved

CX dashboard mapping - export mapping

  • June 11, 2024
  • 14 replies
  • 244 views

kgillis
Level 6 ●●●●●●
Forum|alt.badge.img+31

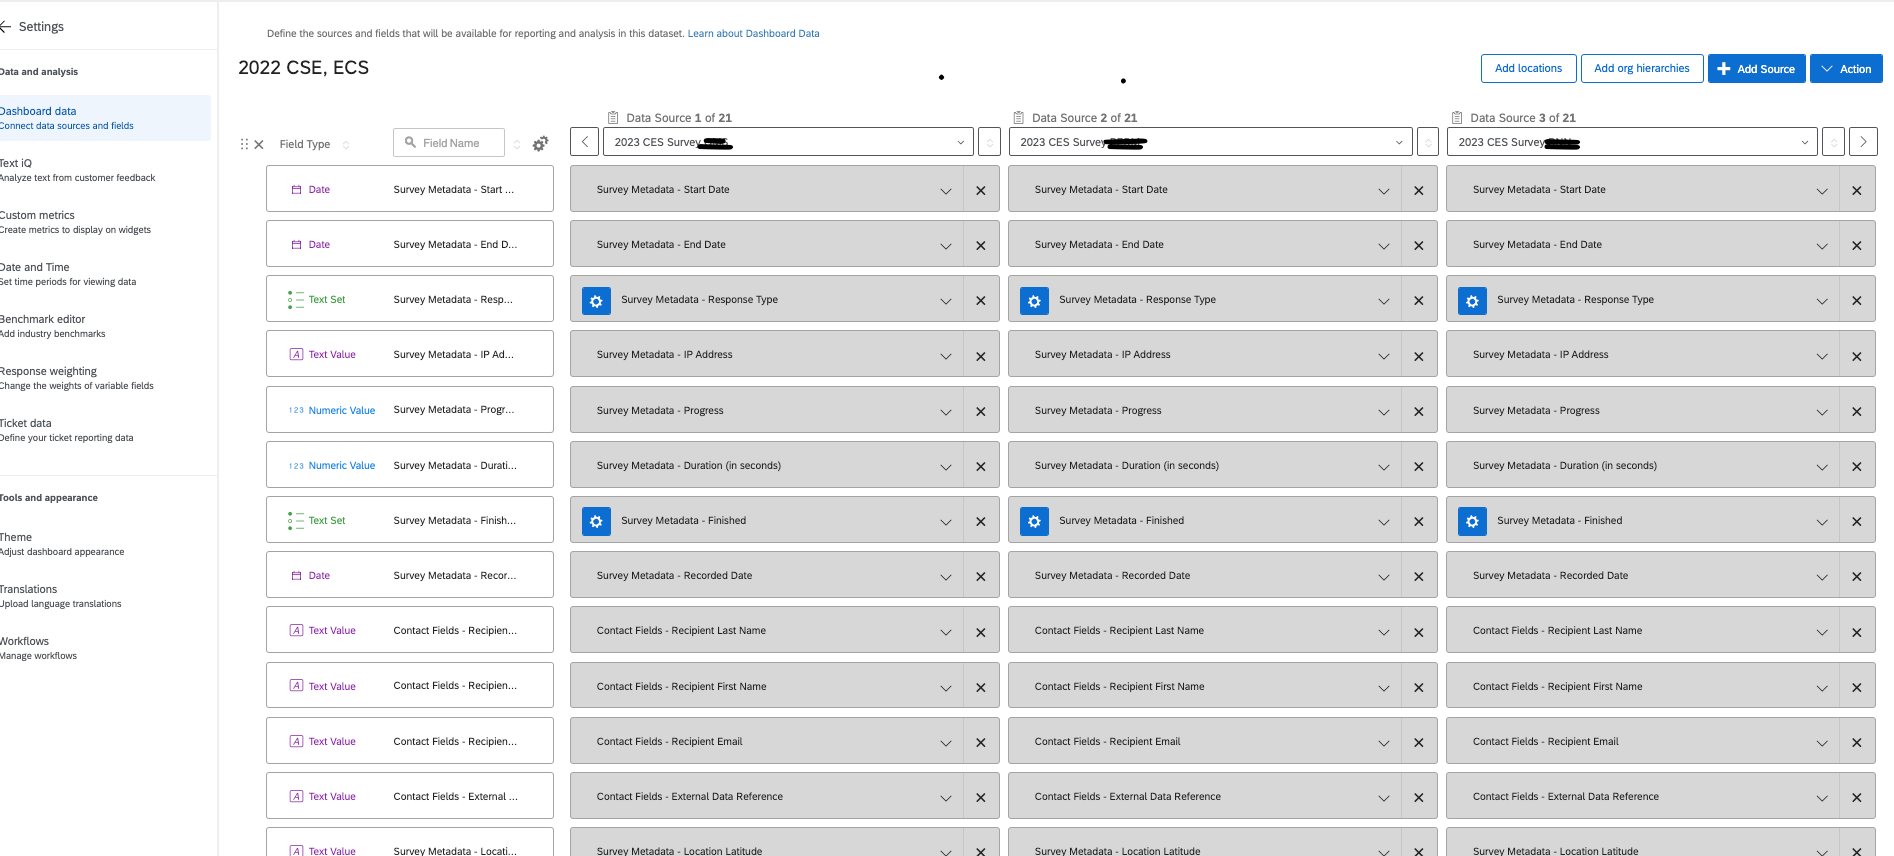
I have a dashboard that has a whole bunch of surveys mapped to it. I have an intern and would like to have them do some documentation on the mapping and am wondering if there is a way to export the mapped data showing in rows and columns just as we see in the dashboard map section. I don’t want to give a qualtrics user license/access so I’m hoping there’s a workaround here for them to be able to view the data as to which survey question is mapped into which field on the dataset. 


Best answer by cami_mq

I hear you.


However, unfortunately, that´s not possible yet.


The path @jbk suggeste will help you to get all the fields with field type mapped into the dashboard. An alternative I´ve used in the past was:


  1.  Go to Data & Analysis;
  2. Export the file in .csv / .xlsx / .tsv ( normally I do it, by filtering the data in order to export just one row with data, so I can make sure I´m doing the data mapping with the right data type in the document).
  3. Open it in Excel, transpose the table and start from there.

It´s not an awsome way to do it but, it is an alternative.


I hope this helps in any way. 🙂

14 replies

Aggarwal
Level 4 ●●●●
Forum|alt.badge.img+15
  • Level 4 ●●●●
  • June 11, 2024

Unfortunately this is not possible, you have to create your own mapping list


cami_mq
Level 2 ●●
Forum|alt.badge.img+4
  • Level 2 ●●
  • July 15, 2024

The only good thing about finding this thread is to be able to confirm that I´m not the only person who would love to get that feature! 😅


Thanks, @kgillis !


  • Level 4 ●●●●
  • July 16, 2024

you can create from support page, but if you want to create a document based on you dashboard, only way to do this, make a copy of the dashboard and give her access to copy version.


So that, even if there is a accidental changes, it wont affect your main dashboard.


cami_mq
Level 2 ●●
Forum|alt.badge.img+4
  • Level 2 ●●
  • July 16, 2024

@jbk , you mean: create a support page with a table. In that table, place every metadata, download it and start from there. Is that it?


  • Level 4 ●●●●
  • July 16, 2024

If you want to create a generic document of mapping the fields, you can use this. But if you want to  create from your dashboard, make a copy of your dashboard, create a user for your intern and share the copied version of the dashboard and ask your intern to create it.


cami_mq
Level 2 ●●
Forum|alt.badge.img+4
  • Level 2 ●●
  • July 16, 2024

@jbk , YOU ROCK!


For my need, which is different from @kgillis this will help a lot!


Thanks for the ideia1 ;)


  • Level 4 ●●●●
  • July 16, 2024

@jbk , YOU ROCK!


For my need, which is different from @kgillis this will help a lot!


Thanks for the ideia1 ;)

Happy to help!


kgillis
Level 6 ●●●●●●
Forum|alt.badge.img+31
  • Author
  • Level 6 ●●●●●●
  • July 16, 2024

I was aiming to basically have like an excel/csv export of everything since I’ve got 21 different surveys mapped and 15 pages of fields, it’s a lot! A csv would be quicker to reference plus we could get it on one screen rather than having to move through separate pages.


cami_mq
Level 2 ●●
Forum|alt.badge.img+4
  • Level 2 ●●
  • Answer
  • July 17, 2024

I hear you.


However, unfortunately, that´s not possible yet.


The path @jbk suggeste will help you to get all the fields with field type mapped into the dashboard. An alternative I´ve used in the past was:


  1.  Go to Data & Analysis;
  2. Export the file in .csv / .xlsx / .tsv ( normally I do it, by filtering the data in order to export just one row with data, so I can make sure I´m doing the data mapping with the right data type in the document).
  3. Open it in Excel, transpose the table and start from there.

It´s not an awsome way to do it but, it is an alternative.


I hope this helps in any way. 🙂


arunxmarchitect
Level 3 ●●●
Forum|alt.badge.img+6

@kgillis ​@cami_mq , I have developed a workaround script that runs on your browser that exports the dashboard mapping. 


Original discussion: 


I wanted to share a free tool I created to help with Dashboard Data documentation – something I've seen come up in discussions here about migrations and configuration management.

The Challenge: Manually documenting which fields are mapped to which data sources in Dashboard Data is time-consuming, especially when you're working with multiple sources or planning migrations.

The Solution: A browser-based script that extracts your complete Dashboard Data configuration in seconds:

✓ All field types (Date, Text Set, Number Set, Open Text, etc.)

✓ Full field names (no truncation)

✓ Complete data source mappings

✓ Shows which fields are "Not mapped" for each source

✓ Export to CSV, Excel, or JSON

Watch the 30-second demo: 


Full step-by-step guide with script: https://piraiai.com/blog/extract-qualtrics-dashboard-mappings


Forum|alt.badge.img+8
  • QPN Level 4 ●●●●
  • February 17, 2026

Hi Arun,


Wow, this is really impressive, great work here! It seems to only work on the data mapper and not the data modeler so will not work on all my use cases. But still, this is very cool to see and should address ​@kgillis ‘s issue.


@kgillis ​@cami_mq , I have developed a workaround script that runs on your browser that exports the dashboard mapping. 


Original discussion: 


I wanted to share a free tool I created to help with Dashboard Data documentation – something I've seen come up in discussions here about migrations and configuration management.

The Challenge: Manually documenting which fields are mapped to which data sources in Dashboard Data is time-consuming, especially when you're working with multiple sources or planning migrations.

The Solution: A browser-based script that extracts your complete Dashboard Data configuration in seconds:

✓ All field types (Date, Text Set, Number Set, Open Text, etc.)

✓ Full field names (no truncation)

✓ Complete data source mappings

✓ Shows which fields are "Not mapped" for each source

✓ Export to CSV, Excel, or JSON

Watch the 30-second demo: 


Full step-by-step guide with script: https://piraiai.com/blog/extract-qualtrics-dashboard-mappings


arunxmarchitect
Level 3 ●●●
Forum|alt.badge.img+6

Thanks ​@jake_dufinetz !!

I will explore if a workaround can be created for the data modeler.


Forum|alt.badge.img
  • February 28, 2026

@arunxmarchitect really cool work here!

Is there any way for the script to pull all of the sources in the data mapper? I have a dashboard with 27 sources and I’d prefer not to have to complete 9 exports. 

Unfortunately, I don’t have enough experience with the Browser console myself to know if this possible (though I’d guess it’s not possible because the the Browser console only has access to what’s on the screen in the moment).  Either way, very cool tool!


arunxmarchitect
Level 3 ●●●
Forum|alt.badge.img+6

Thanks ​@WillRippey , 

Please let me know if you need assistance it shouldn’t take no more than 10 mins.


Regards,

Arun