Displaying a grid question in Dashboard | XM Community
Question

Displaying a grid question in Dashboard

  • 15 September 2023
  • 8 replies
  • 140 views

Userlevel 3
Badge +6

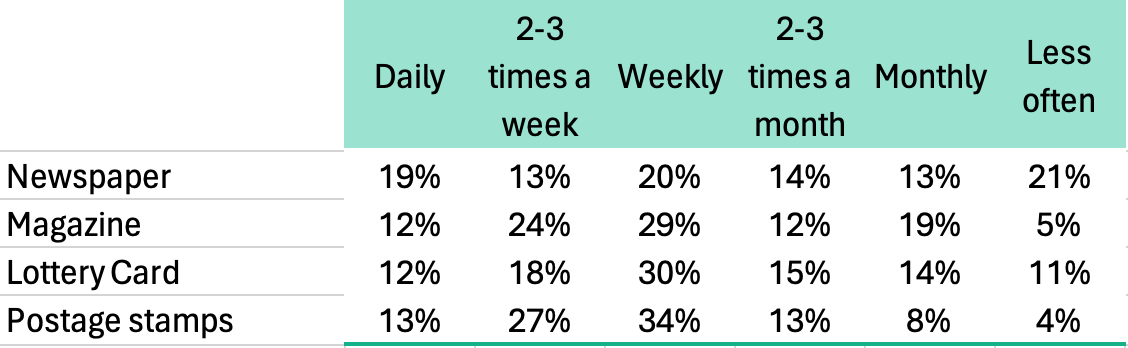
I have a survey with several grid questions and I would like to be able to display the responses in one table, more or less the same as the grid looks in the survey (statements in rows, options in columns, answers as %)


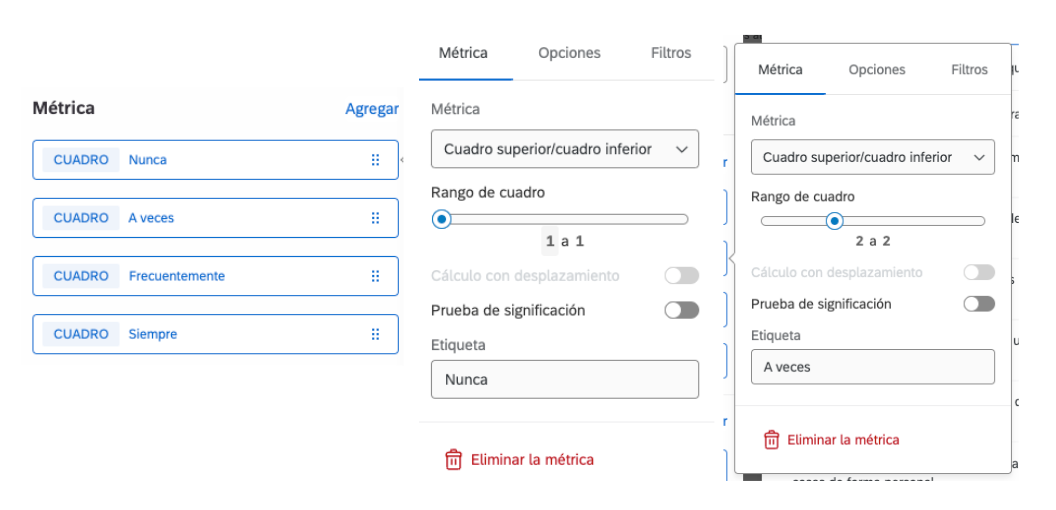
I have tried all the table options within dashboard and can’t seem to make any of them work in the way that I would like.  The only option I have at the moment is to show them as individual charts, one per statement, which is rather tedious.


Does anyone have the knowledge I seek?


Thanks in advance!


8 replies

Userlevel 5
Badge +17

@Arthur_Fletcher What is your requirement, how do you want to show matrix question in the dashboard

Userlevel 6
Badge +14

There’s instructions here on how to configure a table widget: 

https://www.qualtrics.com/support/vocalize/widgets/table-widgets/table-widget/

Userlevel 3
Badge +6


Here’s an example (fictitious) where the question might be 'How often do you buy these items from a convenience store?’

Userlevel 6
Badge +14

Within your dashboard settings, you could click “add field group” at the bottom and add all the statements like magazine, newspaper, etc. to that field group. Then, within the dashboard, add table widget and select “Top box/bottom box” as the metric, and you would select your field group name as the question to pull that top box/bottom box metric from.

Userlevel 3
Badge +6

Hi ash123, thanks for offering up your suggestion but I couldn't make it work.  I created a field group from all the statements (mapped to the individual questions in the grid) but I end up with the same mess.

There must be a simple way to take a grid question and add it to a dashboard?  

Userlevel 6
Badge +14

What is happening to the widget when creating the table that way? Are you have trouble getting it to show percents instead of counts? Or are you have issues getting all the statements to appear?

Userlevel 3
Badge +6

Hi ash123, I have created a field group as suggested - it contains 12 statements and each statement has 3 options, so I am looking to create a table with 12x3 cells.

In the table widget, I set up a count metric and when I select rows or columns, the combined field group is not shown, just the 12 statements individually.  If I add these individually, the system somehow combines the statements/choices.  For example if I add 2 statements, I get a table with 9 answers - the 3 options combined for statements 1 and 2.  If I add 3 statements, I get a table with 27 numbers- the 3 options combined for statements 1,2 and 3.

Clearly I am doing something wrong

Badge

Thanks for this question + answer Arthur & Ash.

I could create the table I needed. If it helps anyone the “Top box/bottom box” need to be set as many times as answer options you have (in my case 4, Never, Often, Usually, Always), and for each one set the box as a whole.


Leave a Reply