Help with Calculating Average in Gauge Chart | XM Community

Help with Calculating Average in Gauge Chart

  • 15 December 2022
  • 8 replies
  • 409 views

Userlevel 1
Badge +2

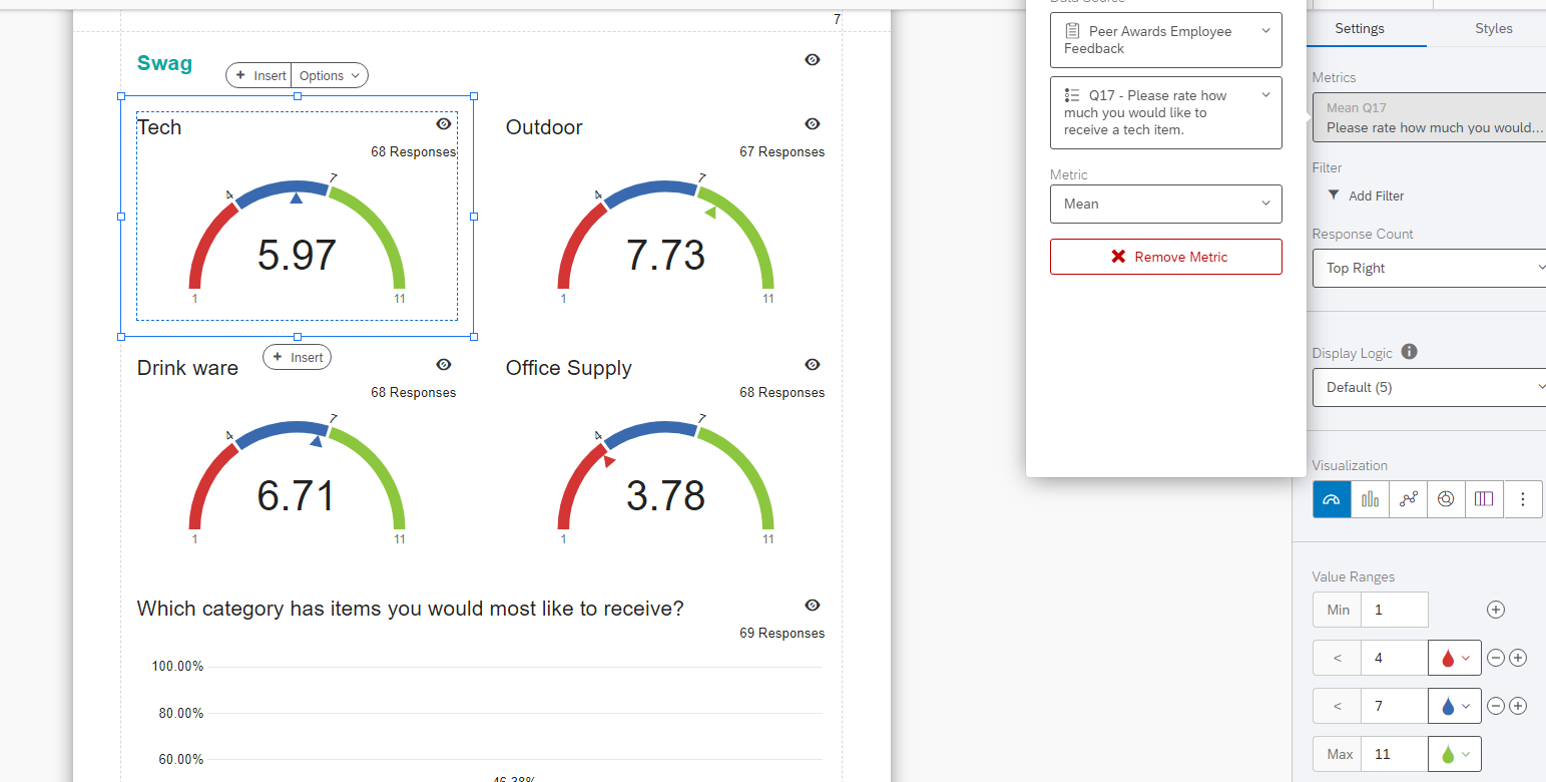
New to Qualtrics and I'm sure this is all user error on my part. But I'm trying to create a Gauge Chart widget to show the Average Overall Satisfaction reported. Scale is 1 to 5, with 5 being Very Satisfied. When I edit the question to Gauge Chart and select "Average" for the Metrics, I do not get the Average Overall Satisfaction. What additional inputs do I need to provide so that the Gauge Chart calculates the Average?
Metric: Average
Field: Response Type


8 replies

Userlevel 4
Badge +24

Hi B_Griffith - it would help to better understand what you're expecting to see vs what the widget is displaying. What settings are applied? Is your question mapped correctly? Are you able to provide more details or a few visuals? I'd be happy to help you troubleshoot. :)

Userlevel 1
Badge +2

CMurph Thank you! I've got a question that asks for the Overall Satisfaction with the usual 1-5 scale, with 5 being Strongly Agree. I have the responses coded for 5 to equal Strongly Agree and on down to 1 for Strongly Disagree. I'm trying to create a Gauge Chart in the Results tab. I have 52 responses, that should average to an Overall Satisfaction of 2.9, but the Gauge Chart tells me 1.9. In fact, it's giving the "1.9" answer for ALL the questions in the survey when I try to get an average using the Gauge Chart. I have the question as a Multiple Choice and no embedded data in the survey. When creating the Gauge Chart widget, I have "Average (Response Type)" selected for the Metrics. I do not have anything selected under the Filters or Comparisons areas. For the "Display" I have Min as "1", then "3", "4", and the Max at "5". All the other chart types appear to calculate correctly...just not the Gauge Chart, so I know it's got to be something I'm not doing correctly.

Userlevel 4
Badge +24

B_Griffith Apologies for my delayed reply! That is puzzling that the average is so much lower in the gauge chart. I'm curious - when you add the response count to the widget, is it pulling in the exact number of responses you are using in your manual calculations? Additionally, if you duplicate that widget and have it calculate the top box, do you get the same result as you do with a manual calculation of CSAT? It just seems like something isn't pulling in accurately, but it's so hard to guess without being hands on! :)

Userlevel 1
Badge +2

CMurph Good morning! Thank you very much for trying to assist me with this. I have continued to try and figure it out, but with no success. However, it seems to be with all Widgets that I try to get an Average on. I created a Breakdown Bar based on Response Type percentage, and that calculated correctly. However, when I try to calculate the Average for ANY of the widget types, I get 2.0...no matter which widget I use, and no matter which question I select. So, I think you're right, Qualtrics isn't pulling something in correctly, and I'm guessing it's something I'm doing on my side. I did check on the Count, and it does include all the responses received for the survey, and the same number that I'm using in my manual calculations. For example, for one question, on a Horizontal Chart, it shows the correct number of responses that gave "Agree", which was 10. However, the Average for Response Type is listed as 2.0. Same for "Somewhat Agree" and "Somewhat Disagree" responses. They both had 7 responses, but the Average is reported as 2.0.
On a side note, I even did the Qualtrics Training and uploaded their sample Pizza and Ice Cream survey, and I had the same problem. I was able to replicate all the other widgets in their training, but my Average for the Gauge Chart was not correct and did not match what the Qualtrics Training said it should.

Userlevel 7
Badge +38

B_Griffith it sounds like you are working in the Results-Dashboard. I have the same problem as you where when I pick a Likert Scale question I cannot get the program to calculate a mean on the recode values. Instead it wants you to pick a dimension ("field") that is numeric: duration in seconds, finished, progress, or response type. Unfortunately these will never line up with what you want and what we could easily see in the past.
The only way you can get the average is to use a question type that defaults to numeric: text entry numeric validation, slider, rank order, constant sum, pick group and rank, NPS, timing. Multiple choice questions are automatically stored as text sets. Text sets are only compatible with line and bar charts, tables, breakdown bars.
My recommendation is building out in advanced reports instead of the results dashboard. That will allow you to create the widget you want. Settings:

  • Data source = survey / question number

  • Metric = mean

widget.png

Userlevel 1
Badge +2

bstrahin Thank you!!! You are exactly right. I was using the Results Dashboard. When I moved to the Report tab and added Gauge Charts for the questions, they calculated the means correctly.
Do you know if there's a way to change multiple choice questions to numeric, so a Gauge Chart works in Results? Or should a different question type be used?

Userlevel 7
Badge +38

B_Griffith from the documentation on the Support pages that does not seem possible. I have moved away from using the Results-Dashboards because I find them a lot more frustrating that the previous results reports. So if you want to use Dashboards my suggestions are either to

  1. Use a question type that treats the data as numeric

  2. Submit a feature request through this site that the functionality in Advanced Reports be available in dashboards for calculating means on Likert scales. This will give others to opportunity to either support your request (upvotes and providing examples) or maybe give you a better work around than I have.

Badge +2

@B_Griffith I was just encountering this too, and came up with a workaround. You can create a new field in the Data & Analysis tab for the question and choose “numeric” as the tag. You can then use that new field (which will come through as embedded data), for your gauge chart in the Results tab. 

Leave a Reply