I want to show a daily cumulative number of the survey responses (total responses until each day in the list)? whether in a table or a chart..
E.g. if Feb 1st = 100 responses, Feb 2nd = 50 responses, Feb 3rd = 100 repsonses, I want to show it as
Feb 1st cum =100, Feb 2nd cum= 150, Feb 3rd cum= 250.
Similarly for the NPS, are there any of these options??
Thanks!

Solved
Is there any way in the dashboard to display a daily cumulative number of responses and NPS?
Best answer by CMurph
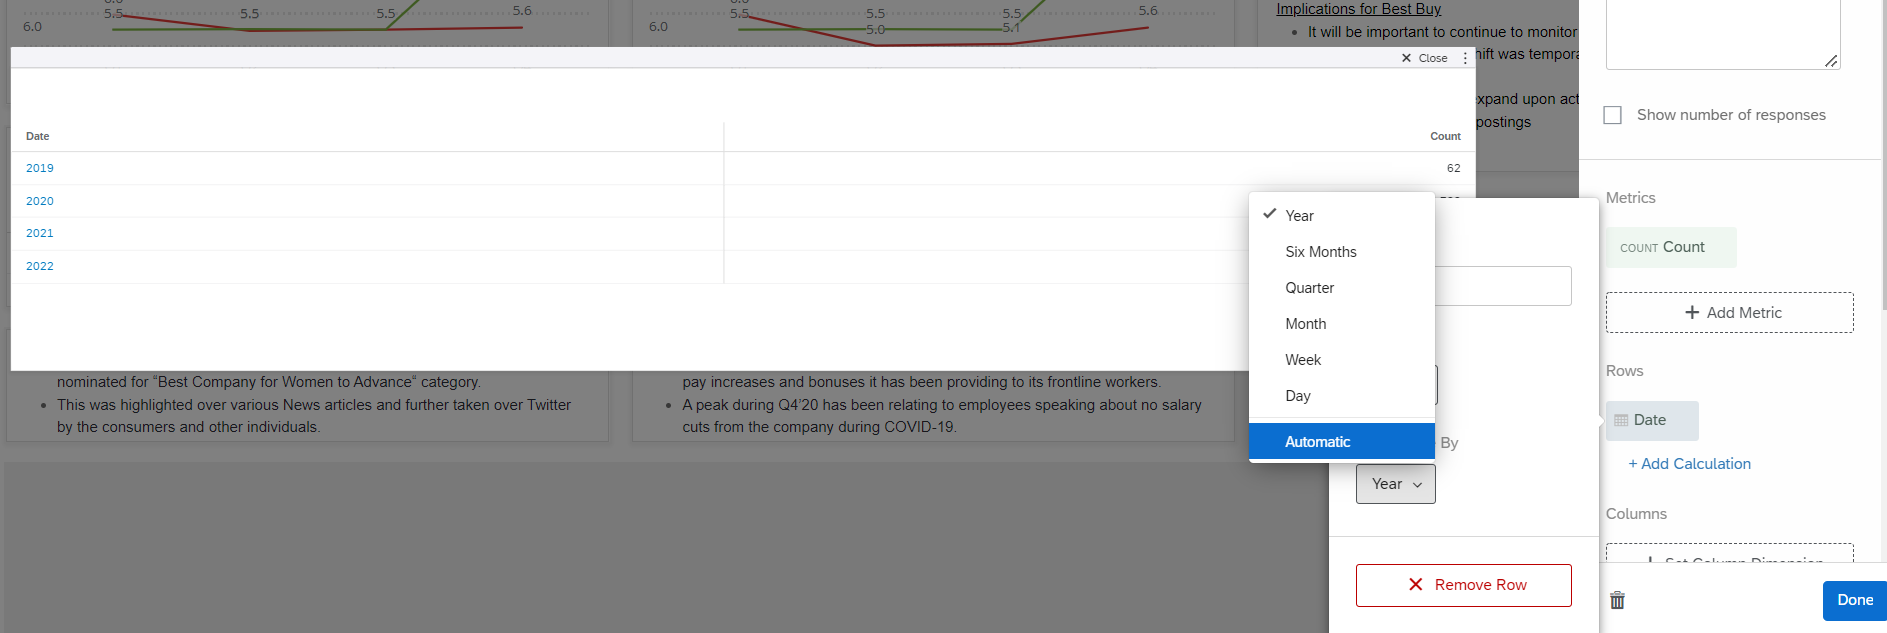
https://community.qualtrics.com/XMcommunity/discussion/comment/43994#Comment_43994This will show each day's count, but doesn't allow for a cumulative calculation. I'm not sure I'm aware of a way to do that Abeer_Ahmed without a lot of manual effort. For instance, if you create a simple chart or table and add count metrics for the number of days you want to track and then filter each count metric on a date. Say you want to track 7 days of data, so you add 7 count metrics. For each metric, you could use a date filter and set a specific time frame/date range on each metric. So count metric 1 would be from 2/1 to 2/1, then count metric 2 from 2/1-2/2, then count metric 3 from 2/1-2/3 and so on. I think this would apply for NPS, as well.
Obviously, this is something that would require ongoing manual updating, which is likely not helpful if you have a survey the runs continuously. I'm just not sure I've seen a way to set it up the way you've mentioned. I know Qualtrics has data or dashboard engineers that can build custom widgets for you - maybe that's an option?


Sign up
Already have an account? Login

Welcome! To join the Qualtrics Experience Community, log in with your existing Qualtrics credentials below.
Confirm your username, share a bit about yourself, then you're ready to explore and connect .
Free trial account? No problem. Log in with your trial credentials to join.
No free trial account? No problem! Register here
Already a member? Hi and welcome back! We're glad you're here 🙂
You will see the Qualtrics login page briefly before being taken to the Experience Community.
Login with Qualtrics
Welcome! To join the Qualtrics Experience Community, log in with your existing Qualtrics credentials below.
Confirm your username, share a bit about yourself, then you're ready to explore and connect .
Free trial account? No problem. Log in with your trial credentials to join. No free trial account? No problem! Register here
Already a member? Hi and welcome back! We're glad you're here 🙂
You will see the Qualtrics login page briefly before being taken to the Experience Community.
Login to the Community
No account yet? Create an account
Welcome! To join the Qualtrics Experience Community, log in with your existing Qualtrics credentials below.
Confirm your username, share a bit about yourself, then you're ready to explore and connect .
Free trial account? No problem. Log in with your trial credentials to join.
No free trial account? No problem! Register here
Already a member? Hi and welcome back! We're glad you're here 🙂
You will see the Qualtrics login page briefly before being taken to the Experience Community.
Login with Qualtrics
Welcome! To join the Qualtrics Experience Community, log in with your existing Qualtrics credentials below.
Confirm your username, share a bit about yourself, then you're ready to explore and connect .
Free trial account? No problem. Log in with your trial credentials to join. No free trial account? No problem! Register here
Already a member? Hi and welcome back! We're glad you're here 🙂
You will see the Qualtrics login page briefly before being taken to the Experience Community.
Enter your E-mail address. We'll send you an e-mail with instructions to reset your password.