Hi,
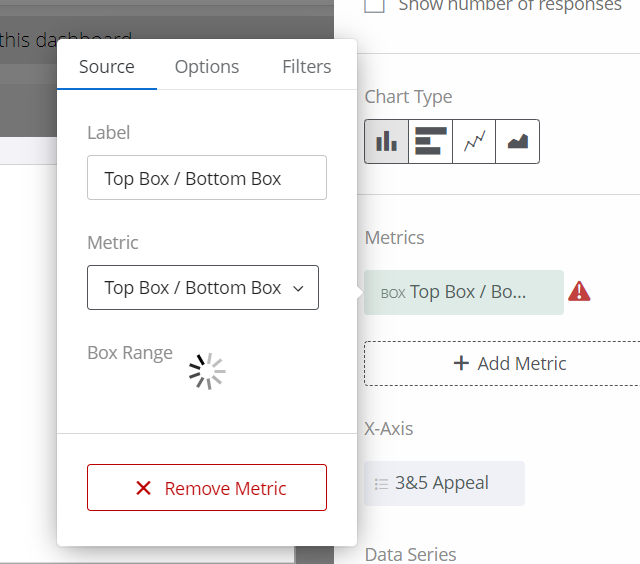
I am having trouble pulling through a Field Group (measure group) that I created in the data mapper (settings page) into a widget. For simplicity I chose two of the same questions which refer to two different products to be able to see the data for both products in one widget. The question is 'How appealing would you say this product is to you?" and both have the same 1 to 5 scale (Extremely appealing to extremely unappealing). I went and re-coded the values into Top 2 Box, Middle, and Bottom 2 Box. When i went to the x-axis to add the field group to the widget and to change the metric, I selected the 'Top/Bottom' box option and a red caution sign appeared and the thinking wheel went on forever. The only thing it would spit out was the total count. Originally the data mapper had the two fields as 'number set' but i changed them to 'text set', since that is their format in the data mapper. I'd appreciate if someone could tell me what I am doing wrong and how to correctly go about displaying. Did I even need to recode the values? Here are some snap shots below to help. I can go into further detail if needed or jump on a zoom call for visibility with someone as well.
 Thanks,
Alex
Trouble showing Field Group in widget
Best answer by Mishraji
All fields within a measure group should have the field type set as 'Number Set'. Do not recode the values as Top 2 Box, Middle, and Bottom 2 Box in the data source.
Once you update your data source, come to the dashboard and add three top box/bottom box metrics in a simple chart/table widget. For each metric, select the measure group as the field and then set the scale as 4-5, 3 and 1-2 for Top 2 Box, Middle, and Bottom 2 Box respectively.
Your widget will show appropriate data now.
Sign up
Already have an account? Login

Welcome! To join the Qualtrics Experience Community, log in with your existing Qualtrics credentials below.
Confirm your username, share a bit about yourself, Once your account has been approved by our admins then you're ready to explore and connect .
Free trial account? No problem. Log in with your trial credentials to join.
No free trial account? No problem! Register here
Already a member? Hi and welcome back! We're glad you're here 🙂
You will see the Qualtrics login page briefly before being taken to the Experience Community
Login with Qualtrics

Welcome! To join the Qualtrics Experience Community, log in with your existing Qualtrics credentials below.
Confirm your username, share a bit about yourself, Once your account has been approved by our admins then you're ready to explore and connect .
Free trial account? No problem. Log in with your trial credentials to join. No free trial account? No problem! Register here
Already a member? Hi and welcome back! We're glad you're here 🙂
You will see the Qualtrics login page briefly before being taken to the Experience Community
Login to the Community

Welcome! To join the Qualtrics Experience Community, log in with your existing Qualtrics credentials below.
Confirm your username, share a bit about yourself, Once your account has been approved by our admins then you're ready to explore and connect .
Free trial account? No problem. Log in with your trial credentials to join.
No free trial account? No problem! Register here
Already a member? Hi and welcome back! We're glad you're here 🙂
You will see the Qualtrics login page briefly before being taken to the Experience Community
Login with Qualtrics

Welcome! To join the Qualtrics Experience Community, log in with your existing Qualtrics credentials below.
Confirm your username, share a bit about yourself, Once your account has been approved by our admins then you're ready to explore and connect .
Free trial account? No problem. Log in with your trial credentials to join. No free trial account? No problem! Register here
Already a member? Hi and welcome back! We're glad you're here 🙂
You will see the Qualtrics login page briefly before being taken to the Experience Community
Enter your E-mail address. We'll send you an e-mail with instructions to reset your password.


