Can i have a widget that shows the number of KPi that improve compare with historical data? | XM Community
Skip to main content
Question

Can i have a widget that shows the number of KPi that improve compare with historical data?


Forum|alt.badge.img+8

Hi 

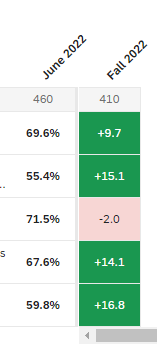
I i am working on a EX engagement survey and i need a widget that show the number of responses that improve compare to the last survey and those that did worse. so for example if i have 26 KPI, and we improve in 3 KPIs and 4 KPS decrease to show this two numbers. the 3 and the 4.


Ignore those other KPIs that did not get any variation regarding the historical data.


Any idea of how can i make this work?

2 replies

jmborzick
QPN Level 5 ●●●●●
Forum|alt.badge.img+41
  • QPN Level 5 ●●●●●
  • 249 replies
  • May 26, 2023

@Erikahuer I think the Heat Map widget would do what you’re looking for. 


Forum|alt.badge.img+8
  • Author
  • QPN Level 4 ●●●●
  • 67 replies
  • May 27, 2023

The thing is that the heat map will show the questions and it's differences. 
We Would need to have just the number of the questions that suffered a positive variation and the number that suffered a negative one.

Something like this:


Leave a Reply