
Hello, can someone help me out? I have a question about how to get the results of a specific question from qualtrics into spss. I am doing an experiment for my Master Thesis in which I present one group with tips (to recognize fake news) and the other one without tips. I can only see who of the respondents got tips by clicking on 'Data and analysis' and clicking on 'View response' and then scroll down to the certain question. However, I have to do this for each respondent which takes a lot of time. Is there an option that I can see a total overview of the participants who got tips and who didn't and export this into spss?

Solved
How can I see a total overview of the participants who are in the control and intervention group?
Best answer by wpm24
Usually you would build in this variable using an embedded data/grouping element in your survey flow under your randomizer. You can see where I describe this in a different post: https://community.qualtrics.com/XMcommunity/discussion/comment/46200#Comment_46200
however, it seems you have already ran the study and cannot now attach this data point. An alternative is that when you go to export your data into whatever format you want (e.g., CSV, excel), click "more options" and check "export viewing order for randomized surveys". This will tell you what order they viewed randomized elements in. This will tell you the order for EVERY randomized element (including question presentation), but it will also tell you which of the two conditions they were randomized to.
You can read more about it here: https://www.qualtrics.com/support/survey-platform/data-and-analysis-module/data/download-data/export-options/ 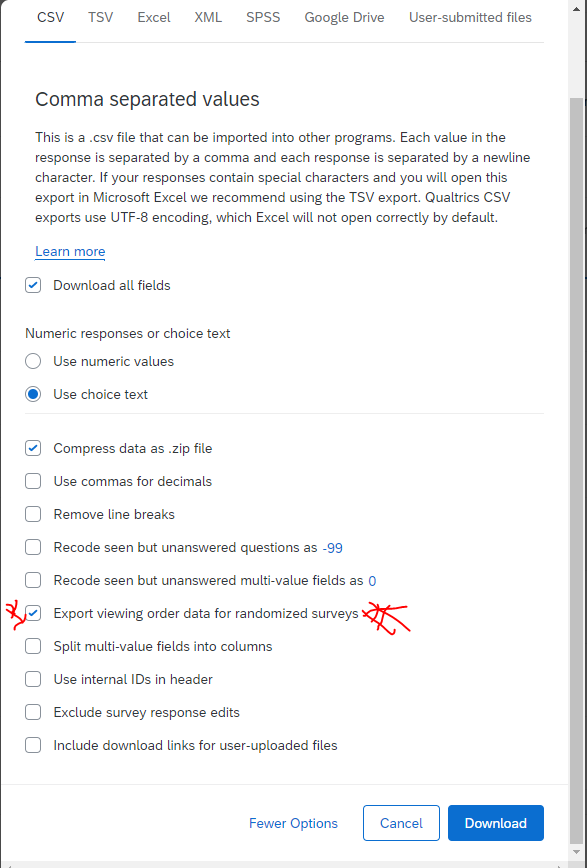
hope this helps!!

Sign up
Already have an account? Login

Welcome! To join the Qualtrics Experience Community, log in with your existing Qualtrics credentials below.
Confirm your username, share a bit about yourself, then you're ready to explore and connect .
Free trial account? No problem. Log in with your trial credentials to join.
No free trial account? No problem! Register here
Already a member? Hi and welcome back! We're glad you're here 🙂
You will see the Qualtrics login page briefly before being taken to the Experience Community.
Login with Qualtrics
Welcome! To join the Qualtrics Experience Community, log in with your existing Qualtrics credentials below.
Confirm your username, share a bit about yourself, then you're ready to explore and connect .
Free trial account? No problem. Log in with your trial credentials to join. No free trial account? No problem! Register here
Already a member? Hi and welcome back! We're glad you're here 🙂
You will see the Qualtrics login page briefly before being taken to the Experience Community.
Login to the Community
No account yet? Create an account
Welcome! To join the Qualtrics Experience Community, log in with your existing Qualtrics credentials below.
Confirm your username, share a bit about yourself, then you're ready to explore and connect .
Free trial account? No problem. Log in with your trial credentials to join.
No free trial account? No problem! Register here
Already a member? Hi and welcome back! We're glad you're here 🙂
You will see the Qualtrics login page briefly before being taken to the Experience Community.
Login with Qualtrics
Welcome! To join the Qualtrics Experience Community, log in with your existing Qualtrics credentials below.
Confirm your username, share a bit about yourself, then you're ready to explore and connect .
Free trial account? No problem. Log in with your trial credentials to join. No free trial account? No problem! Register here
Already a member? Hi and welcome back! We're glad you're here 🙂
You will see the Qualtrics login page briefly before being taken to the Experience Community.
Enter your E-mail address. We'll send you an e-mail with instructions to reset your password.