how to remove empty categories from visualisations? | XM Community
Skip to main content

Hi Hive, 

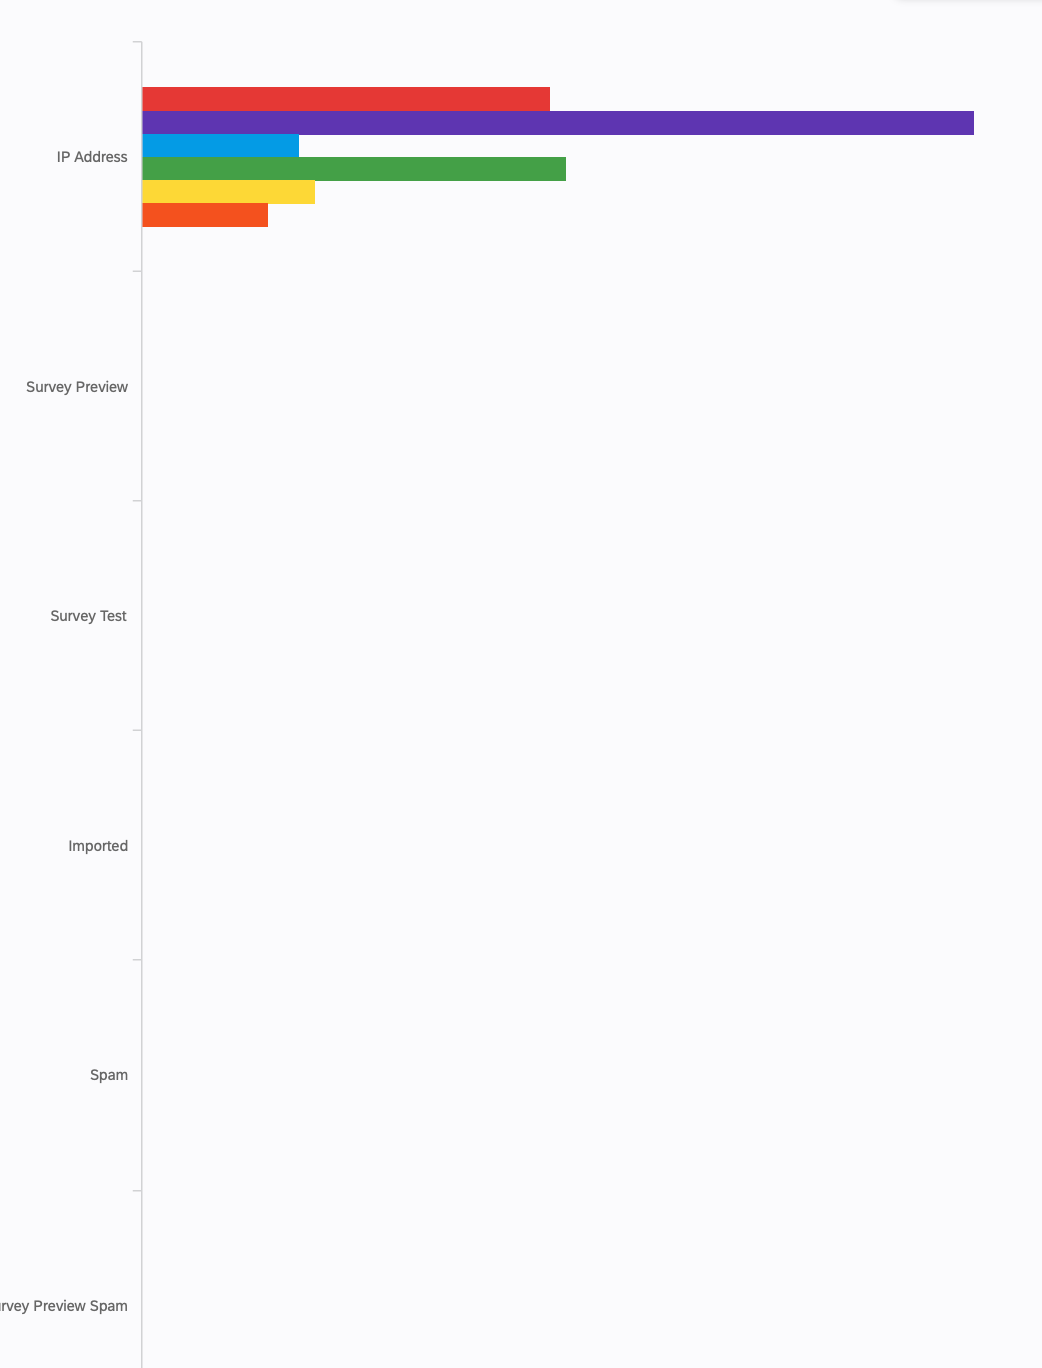
I am running a survey and have the bulk of the results. In the visualisation the software is doing something that I never encountered in previous surveys, namely it is listing responses by “type”, whether they are from IP addresses (the actual responses), or Test, Preview, Spam, imported and a few others (see screenshot).

How do I remove those please and only keep the “IP Address” entries, ideally without that “IP Address” description?

I am sure it is something simple, but I haven’t been able to find it!

Thanks for your help,

Paola


Hi @pmBristol 

You can apply filter in the widgets itself to view only "IP Address" responses in the widget 


Hi @pmBristol , what is the breakdown you have added? it’s response type vs? What do the individual bar colors represent?


Hi @pmBristol,


Here’s what you can do to hide other response types:

Apply a Response Threshold filter as below:


Regarding other query, to hide the “IP Address” it would be good to know what is mapped as data point/X-Axis?

But in case you want to remove it, you can manage it from here by just adding a space:


Hi @pmBristol , what is the breakdown you have added? it’s response type vs? What do the individual bar colors represent?


my bad, I should have explained! The coloured bar represent each one of the possible answers from a multiple choice question.


Hi @pmBristol , what is the breakdown you have added? it’s response type vs? What do the individual bar colors represent?


my bad, I should have explained! The coloured bar represent each one of the possible answers from a multiple choice question.


Perfect, in this case, you can use the above solution I mentioned: Check Solution


thanks!


Leave a Reply