Where should I cut-off "effect size" when reporting questions of Statistical Significance? | XM Community
Solved

Where should I cut-off "effect size" when reporting questions of Statistical Significance?

  • 19 September 2023
  • 6 replies
  • 83 views

Userlevel 3
Badge +8

I’m doing a basic relate series of tests in Stats iQ. My setting is “Order by results of “Relate” analyses by statistical significance and effect size.


I noticed today that it’s really “effect size” by which questions are ordered. So a question with a “strong statistically significant relationship” might come AFTER a question with simply a  “statistically significant relationship”, based on the effect size.


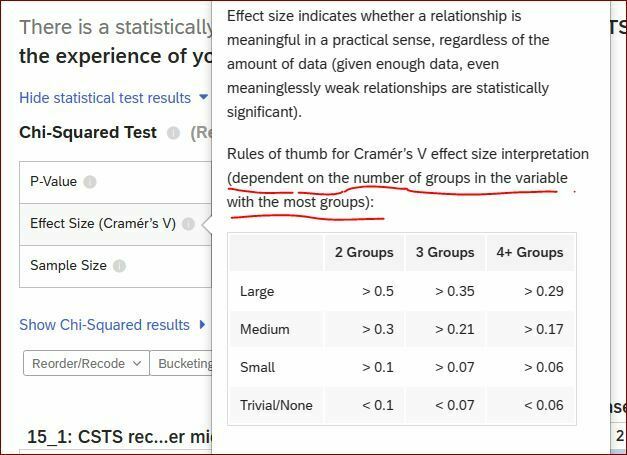
All the tests are Chi-Squared (which I know nothing about ...) 🙄. The very first question has effect size .575, then it goes all the way to .311 which is also a “strong statistically significant relationship”.


I noticed that p values are < 0.00001 for all “strong statistically significant” questions, but still, the effect size determines the ordering of the questions.


My main question is - is there an effect size below which I can cut off when reporting to the user? All of my 17 questions have some statistical significance or some sort, so it doesn’t make sense to me to report all of them (given the nature of the survey).


The 17th question has effect size .237 (p-value .00578)


My take is to cut it off at effect size above .400, but this is just a guess, I can’t really give a statistical justification. In my case, it’s 6 questions.


icon

Best answer by Nam Nguyen 25 September 2023, 13:19

View original

6 replies

Userlevel 1
Badge +2

Hi! Did you check out the Qualtrics guide for effect size (right next to the words “effect size” there is a small (i) button you can press on)? There you will get a guide for that particular statistical test for which effect size is considered trivial, low, medium and high. Note that different effect size thresholds apply for different tests. This is a great place to start, especially if all your results are statistically significant.

Userlevel 7
Badge +20

The size of your sample can mess with your result. If you have a ton of data, even small effects might seem super important statistically, but practically don’t. And, if you're working with a small group, even big effects might not that important

Think about what you're really after in your research. Do you want to shine a spotlight or a more complete picture. Also you field might have it’s own rules about what's a "big enough" effect size. Do check on those standard.

Userlevel 3
Badge +8

Hi! Did you check out the Qualtrics guide for effect size (right next to the words “effect size” there is a small (i) button you can press on)? There you will get a guide for that particular statistical test for which effect size is considered trivial, low, medium and high. Note that different effect size thresholds apply for different tests. This is a great place to start, especially if all your results are statistically significant.

Great suggestion, thank you!

However, I don’t know what this means 🙄 … “Rules of thumb for Cramér’s V effect size interpretation (dependent on the number of groups in the variable with the most groups)”


Userlevel 3
Badge +8

The size of your sample can mess with your result. If you have a ton of data, even small effects might seem super important statistically, but practically don’t. And, if you're working with a small group, even big effects might not that important

Think about what you're really after in your research. Do you want to shine a spotlight or a more complete picture. Also you field might have it’s own rules about what's a "big enough" effect size. Do check on those standard.

Great, thank you. We have very small data set, so I will cull the results judiciously.

Userlevel 1
Badge +2


Great suggestion, thank you!

However, I don’t know what this means 🙄 … “Rules of thumb for Cramér’s V effect size interpretation (dependent on the number of groups in the variable with the most groups)”


Hi!

You need to look at the variables you are studying: let's say you are studying smoking status (smoker vs. non - smoker) and age (20-30 year old, 31-40 year old and 41-50 year old). Then, your smoking variable has 2 groups, and your age variable has 3 groups. The variable with most groups is age. It has 3 groups, so you want to consider the middle column. 

As the text mentions, these are rules of thumb, meaning that researchers are going back and forth about the exact value of the thresholds. But, in general, as long as we are clear about the thresholds we use, that should not be an issue. 


Userlevel 3
Badge +8

You need to look at the variables you are studying: let's say you are studying smoking status (smoker vs. non - smoker) and age (20-30 year old, 31-40 year old and 41-50 year old). Then, your smoking variable has 2 groups, and your age variable has 3 groups. The variable with most groups is age. It has 3 groups, so you want to consider the middle column. 


Ah … makes sense, thank you. I was thinking along those lines but that really helps! 😀

Leave a Reply