I have two surveys that are the same but were conducted three years apart, and I would like to compare the results in a dashboard. I have added the two data sources in the Dashboard Data section, and lined up the matching questions (see below).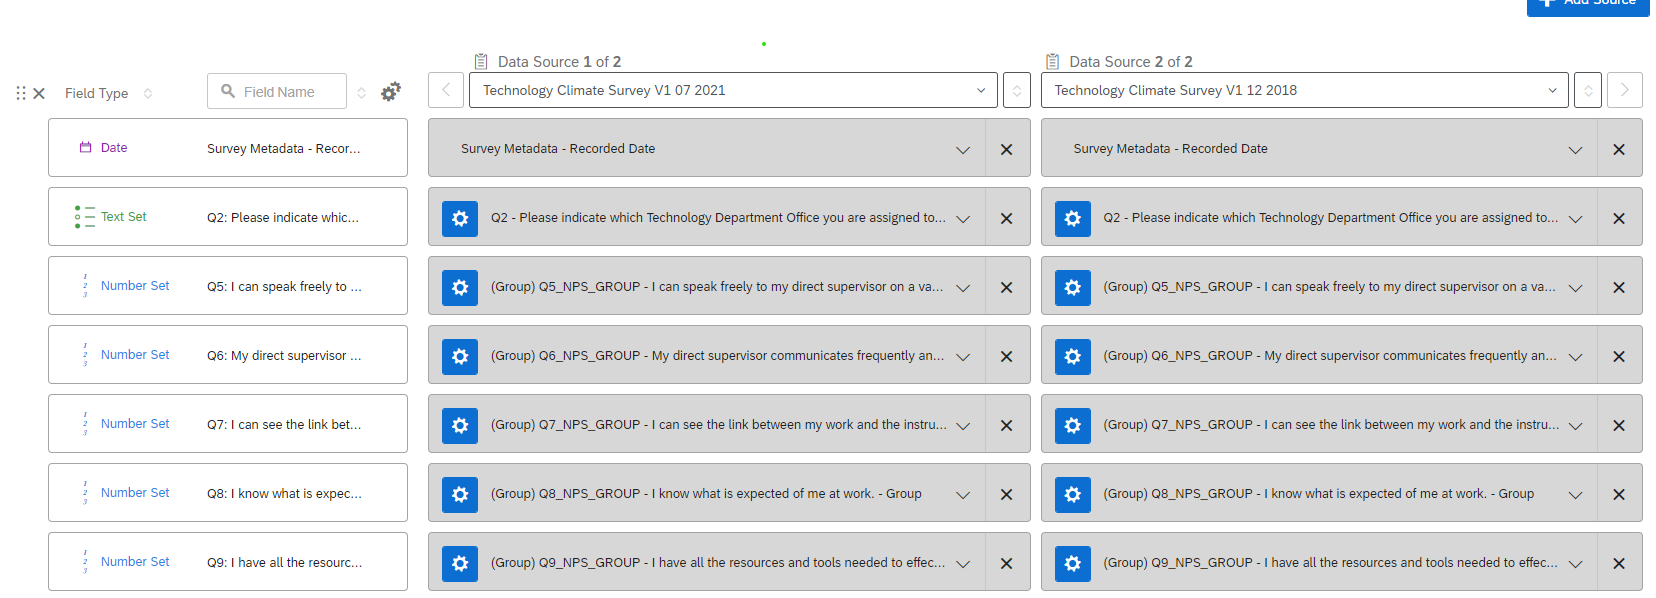 If I go create a chart and set the Data Set Source field as the data series (or create a table and set the Data Set Source as the columns), I only get the data from the 2018 survey.
 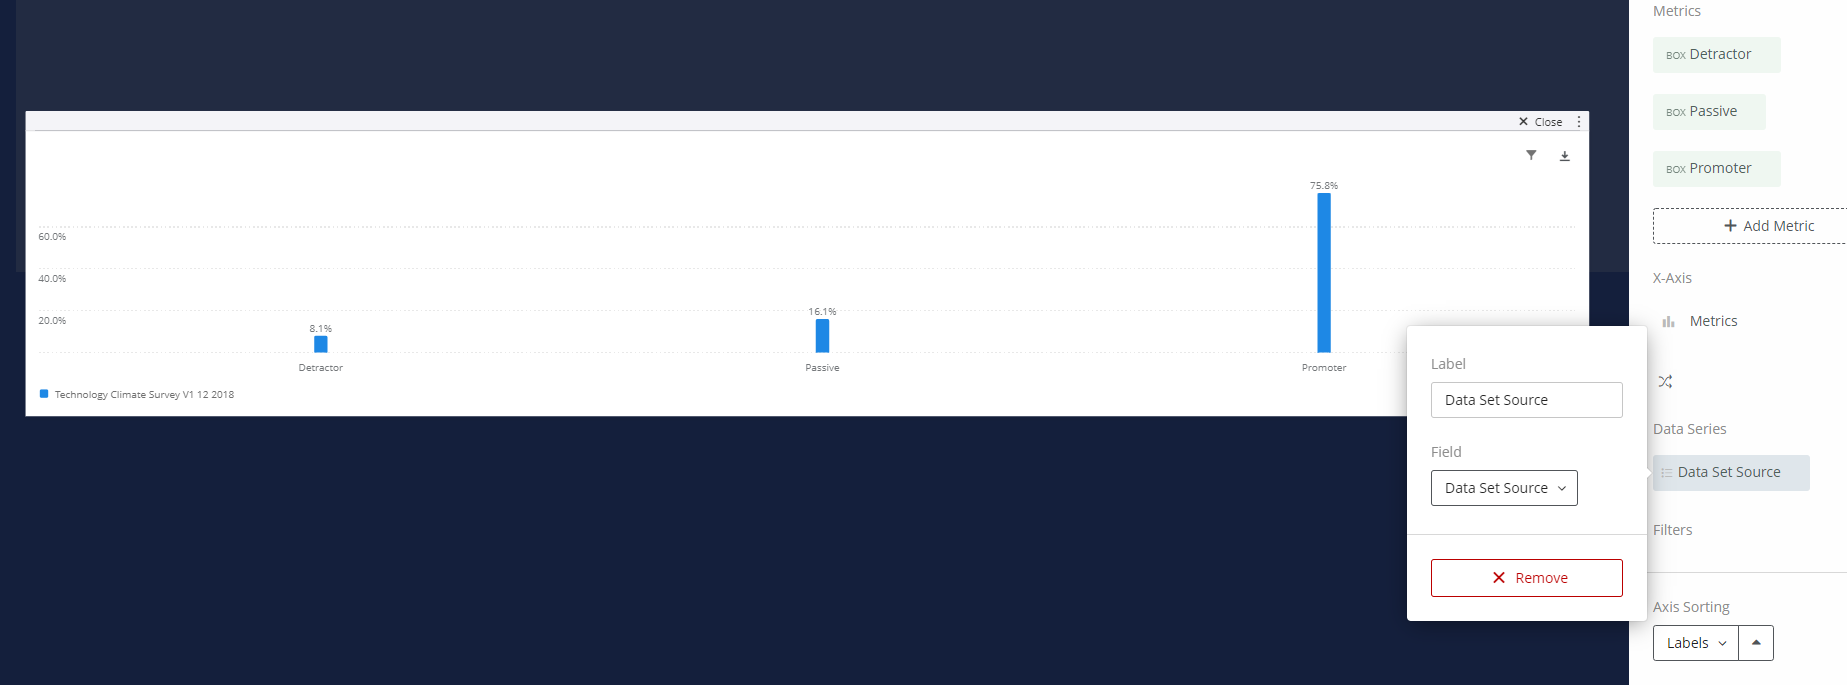 Could anyone help me figure out what I'm doing wrong?

Solved
Comparing Two Surveys in One Dashboard

 +34
+34Best answer by grahulp5
You would need to add a filter and then you can easily filter them out or even form a tabled version comparing 2018 and 2021 data.


Sign up
Already have an account? Login

Welcome! To join the Qualtrics Experience Community, log in with your existing Qualtrics credentials below.
Confirm your username, share a bit about yourself, Once your account has been approved by our admins then you're ready to explore and connect .
Free trial account? No problem. Log in with your trial credentials to join.
No free trial account? No problem! Register here
Already a member? Hi and welcome back! We're glad you're here 🙂
You will see the Qualtrics login page briefly before being taken to the Experience Community
Login with Qualtrics
Welcome! To join the Qualtrics Experience Community, log in with your existing Qualtrics credentials below.
Confirm your username, share a bit about yourself, Once your account has been approved by our admins then you're ready to explore and connect .
Free trial account? No problem. Log in with your trial credentials to join. No free trial account? No problem! Register here
Already a member? Hi and welcome back! We're glad you're here 🙂
You will see the Qualtrics login page briefly before being taken to the Experience Community
Login to the Community
Welcome! To join the Qualtrics Experience Community, log in with your existing Qualtrics credentials below.
Confirm your username, share a bit about yourself, Once your account has been approved by our admins then you're ready to explore and connect .
Free trial account? No problem. Log in with your trial credentials to join.
No free trial account? No problem! Register here
Already a member? Hi and welcome back! We're glad you're here 🙂
You will see the Qualtrics login page briefly before being taken to the Experience Community
Login with Qualtrics
Welcome! To join the Qualtrics Experience Community, log in with your existing Qualtrics credentials below.
Confirm your username, share a bit about yourself, Once your account has been approved by our admins then you're ready to explore and connect .
Free trial account? No problem. Log in with your trial credentials to join. No free trial account? No problem! Register here
Already a member? Hi and welcome back! We're glad you're here 🙂
You will see the Qualtrics login page briefly before being taken to the Experience Community
Enter your E-mail address. We'll send you an e-mail with instructions to reset your password.