Comparison of the average of the topics between bubble chart and bar chart | XM Community
Skip to main content
Question

Comparison of the average of the topics between bubble chart and bar chart

  • July 22, 2024
  • 1 reply
  • 33 views

Forum|alt.badge.img+2
  • Level 3 ●●●
  • 62 replies

Hello community 

Could you help me to understand this difference ...

in the bubble chart I have for the packaging theme an average of -0.4 and for the bar chart for the packaging theme an average of -0.2.


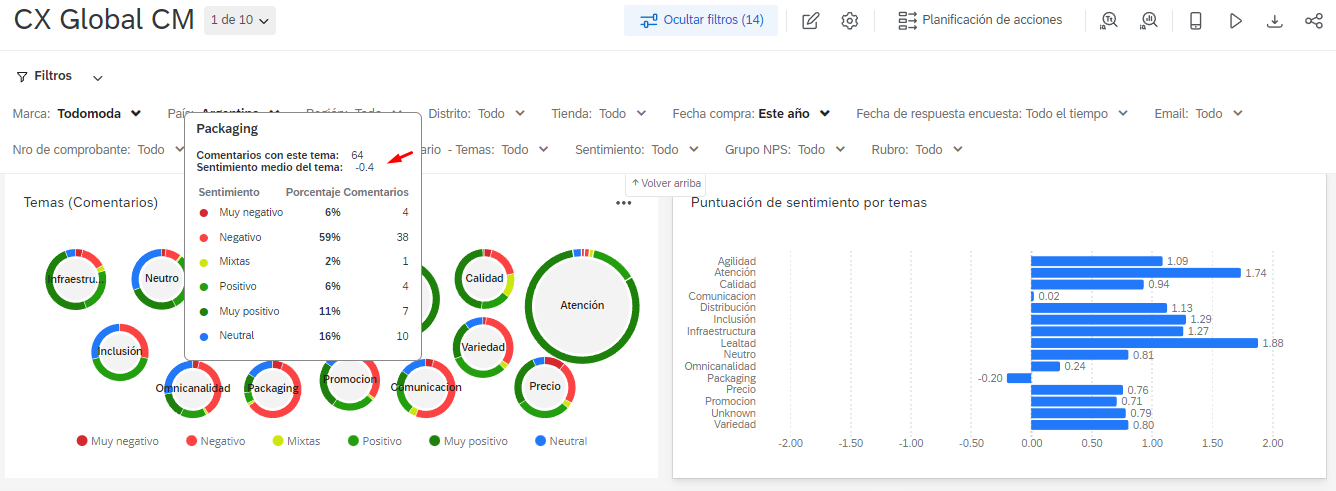
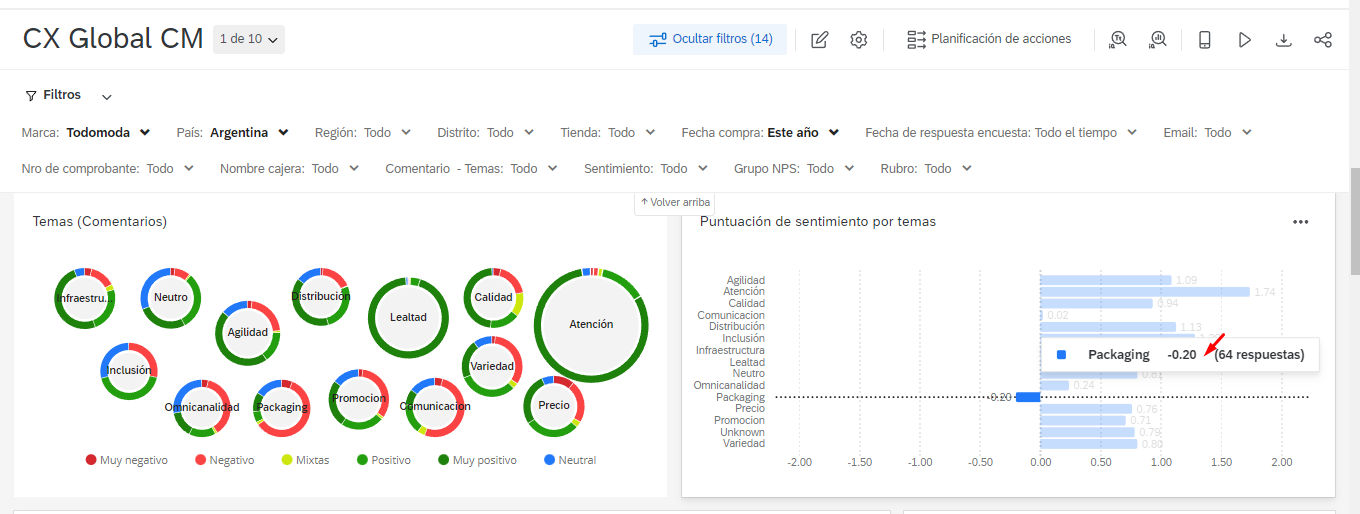
Does it take different bbdd to make the average?


Thank
 

1 reply

Parlante AI
Forum|alt.badge.img+1

Hi Aine, Could you provide a screenshot of the 2 widget settings? Seems weird cause both have 64 responses..

Try to recreate from scratch the bar chart, try also the Text iQ table widget, just to have a third comparison 😅


Leave a Reply